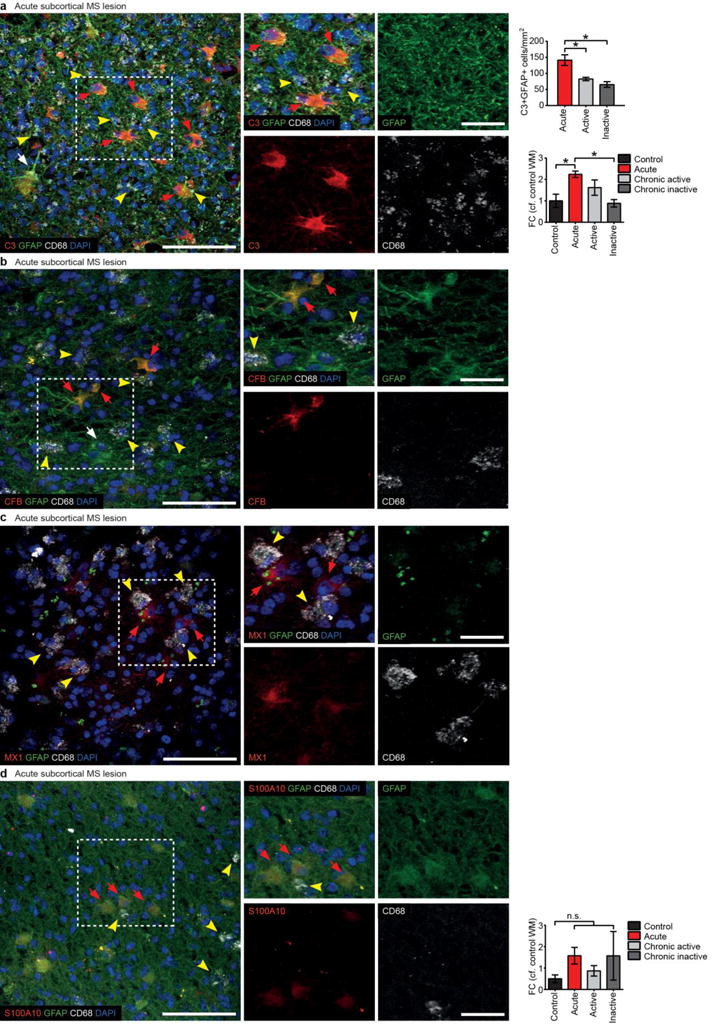
EXTENDED DATA FIG 13. Additional markers for reactive astrocytes in human multiple sclerosis post mortem tissue samples.

a, (same data as Fig. 5o–v – provided again here for comparison) Immunofluorescent staining showing C3 co-localized with GFAP in cell bodies of reactive astrocytes in acute MS lesions (red arrows). Note presence of A1-specific GFAP+ reactive astrocytes (C3+, CFB+, MX1+; red arrows) in close proximity to CD68+ phagocytes (activated microglia, macrophages; yellow arrowheads); A1-specific astrocytes are predominantly seen in high CD68+ density areas. C3-GFAP+ astrocyte (white arrow). Single channels and higher magnification are of selected area in a. Number of C3+GFAP+ colabelled cells is quantified and was highest in acute active demyelinating lesions, however they were still present in chronic active and inactive lesions. There was also a matching increase in C3 transcript in brains of patients with acute active demyelinating lesions compared to age-matched controls. Additional markers of A1 reactive astrocytes include complement factor B (CFB, b), and myxovirus (influenza virus) resistance gene MX dynamin Like GTPase 1 (MX1, c). Both CFB and MX1 co-localised 100% with C3, and were found in close association with CD68+ reactive microglia (yellow arrowheads). d, a single marker was found for A2 (ischemic) reactive astrocytes – S100 calcium-binding protein A10 (S100A10). S100A10 positive, GFAP colabelled astrocytes (red arrows) were only faintly labelled, and total numbers were very low. Note presence of A2-specific GFAP+ reactive astrocytes (S100A10; red arrows) in low CD68+ density areas (phagocytes; yellow arrowheads). The expression levels of S100a10, determined by qPCR, was not significantly altered at different stages of MS. N=3–8 disease and 5–8 control in each instance. Quantification was carried out on 5 fields of view and approximately 50 cells were surveyed per sample. Scale bar: 100 μm (a, b, c, d), 20 μm (enlarged inserts). Error bars indicate s.e.m. * p < 0.05, one-way ANOVA, compared to age-matched control. Abbreviations: FC, fold change; WM, white matter.
