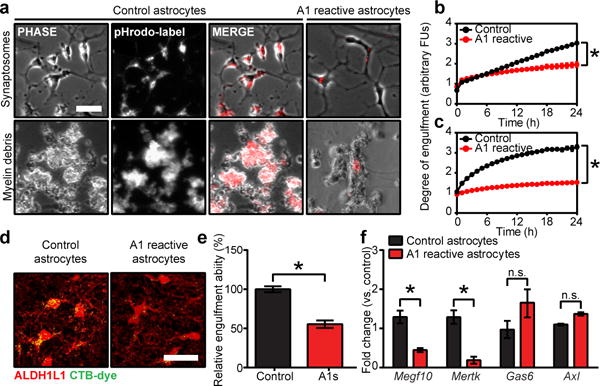
Figure 3. A1 astrocytes lose phagocytic capacity.

a, Phase and fluorescent images of cultured astrocytes engulfing pHrodo-conjugated synaptosomes (quantification in b) and myelin debris (quantification in c). d, Representative confocal reconstruction showing cholera toxin B, CTB-labelled retinal ganglion cell projections engulfed by control and A1 astrocytes in dorsal lateral geniculate nucleus. Quantification in e, n = 4 per group. f, Quantitative PCR analysis of astrocyte-specific phagocytic receptors (Megf10 and Mertk, decreased in A1 reactive astrocytes) and bridging molecules (Gas6 and Axl, unchanged). * p < 0.05, one-way ANOVA, or Student’s t-test as appropriate. Error bars indicate s.e.m. Scale bar: 15 μm (a); 10 μm (f).
