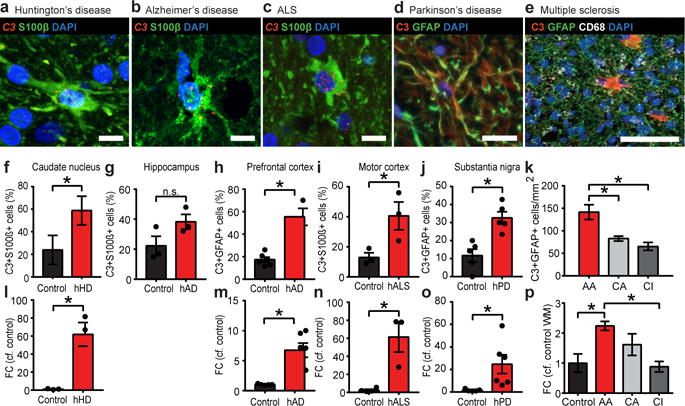
Figure 5. A1 (C3 positive) reactive astrocytes in human disease.

Representative in situ hybridization for C3 and immunofluorescent staining for S100β in Huntington’s (HD, a) and Alzheimer’s (AD, b) diseases, and amyotrophic lateral sclerosis (ALS, c), and co-immunofluorescent staining for C3 and GFAP in Parkinson’s disease (PD, d) and multiple sclerosis (MS, e). Quantification in HD (f), AD in both hippocampus (g) and prefrontal cortex (h), ALS (i), PD (j) and MS (k) shows around 30–60% of astrocytes in brain regions specific to each disease in humans are C3 positive A1s. l–p, Increase in expression of C3 transcript in all diseases (by qPCR). N=3–8 disease and 5–8 control in each instance. Quantification was carried out on 5 fields of view and approximately 50 cells were surveyed per sample. Scale bar: 100 μm (n,o), 20 μm (d,p–t), 10 μm (a–c). Error bars indicate s.e.m. * p < 0.05, Student’s T-test (f–j, l–o), one-way ANOVA (k,p) compared to age-matched control.
