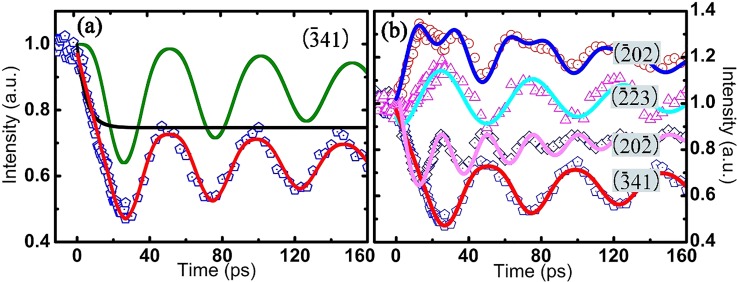
FIG. 6.
The experimental data fitted by theoretical simulations based on the dynamic diffraction theory. (a) The green curve is the intensity evolution when s = kΔc + s0(-341), as shown for the –g Bragg peak in Fig. 5(c). The black solid curve is a simulation to the Debye-Waller effect. The blue pentagon is (-341) experimental data with the theoretically simulated one (the red curve). (b) The time evolution of the (-202) peak intensity can be well fitted by s0 = 0, showing a half periodicity in the lattice expansion following the coherent breathing oscillation. The experimental data for other spots can also be qualitatively simulated by s0 = 0.001/nm for (20-2), s0 = −0.013/nm for (-341), and s0 = 0.003/nm for (-2-23).

