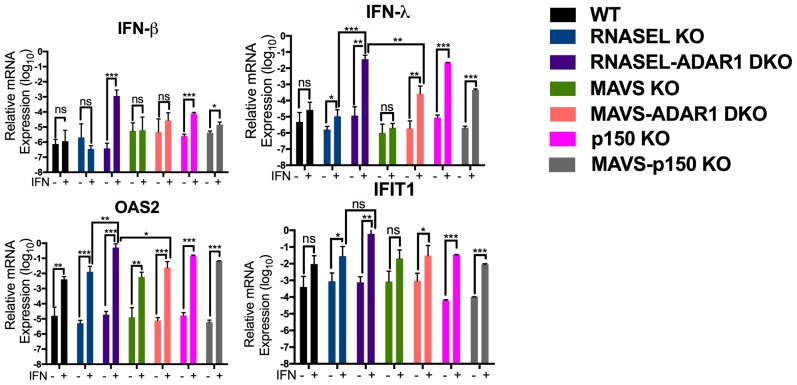
Figure 6. Interferon (IFN) and interferon stimulated gene (ISG) expression following IFN treatment of ADAR1 KO cells.
Cells were treated or mock treated with 10 U/ml of IFN-α and 24 hr post treatment, lysed and RNA extracted. Relative mRNA levels for (a) IFN-β, (b) IFN-λ, (c) OAS2 and (d) IFIT1 were quantified by RT-qPCR, using primers listed in Table 4, and expressed as 2−ΔCT where ΔCT = CT(gene of interest)−CT(β-actin). The data are the average of three independent biological replicates (each with three technical replicates) expressed as means ± SD; *p<0.05, **p<0.01, ***p<0.001. See Figure 6—source data 1 (includes exact P values).
DOI: http://dx.doi.org/10.7554/eLife.25687.020

