. 2017 Mar 18;6:e23474. doi: 10.7554/eLife.23474

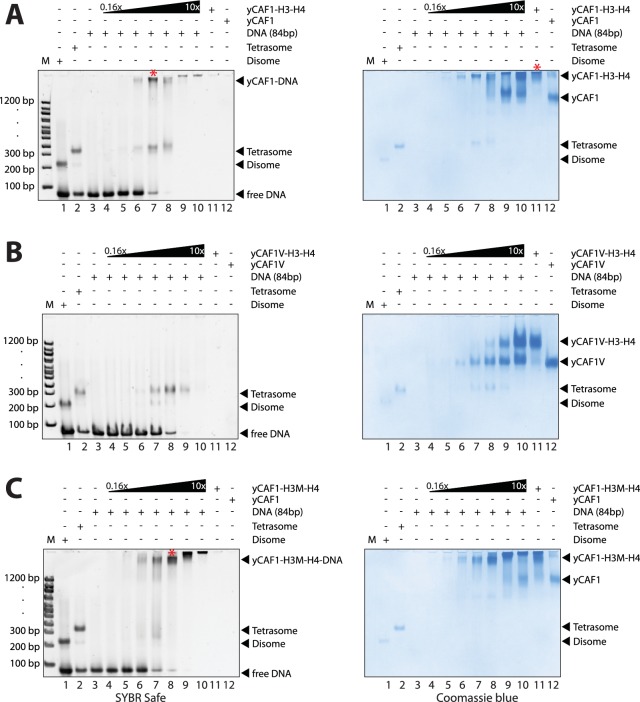
Figure 4. yCAF1 deposition of H3-H4.

(A) EMSA showing tetrasome deposition on 84 bp DNA. Increasing amounts of yCAF1-H3-H4 (0.15, 0.3, 0.61, 1.25, 2.5, 5 or 10 μM) were mixed with 1 μM 84 bp DNA and the bands resolved by native PAGE. Gels were stained for DNA with SYBR Safe (left panel) and for protein with Coomassie (right panel). (B) As above but for yCAF1V-H3-H4. (C) As above but for yCAF1-H3M-H4 (H3M contains the L126R/I130R mutation). * indicates extracted gel bands that we analyzed by SDS-PAGE (Figure 4—figure supplement 2D). All EMSA experiments were repeated at least two times with consistency.

DOI: http://dx.doi.org/10.7554/eLife.23474.015

Figure 4.

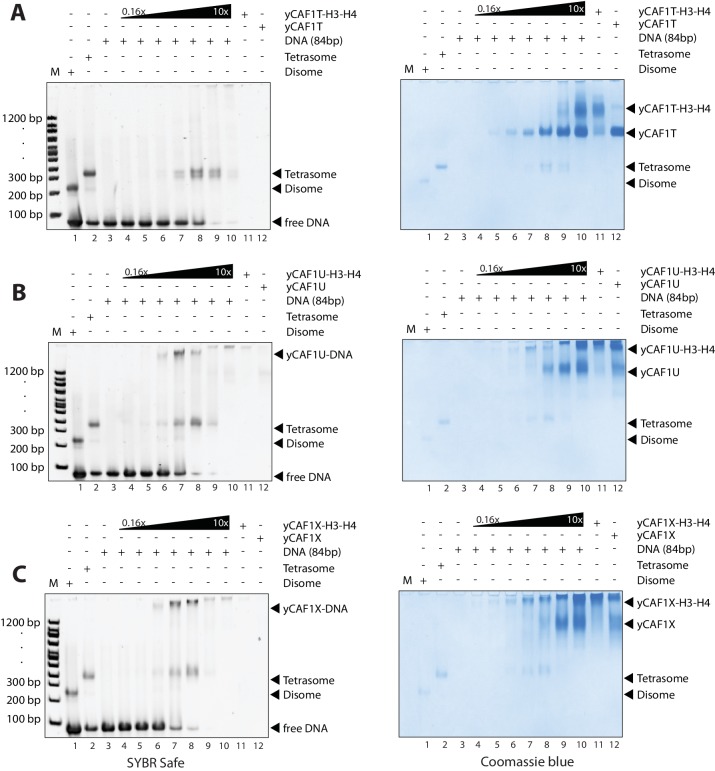
Figure 4—figure supplement 1. EMSA analysis of H3-H4 deposition.

Figure 4—figure supplement 1.

(A) EMSA showing H3-H4 deposition by yCAF1T. (B) yCAF1U. (C) yCAF1X.
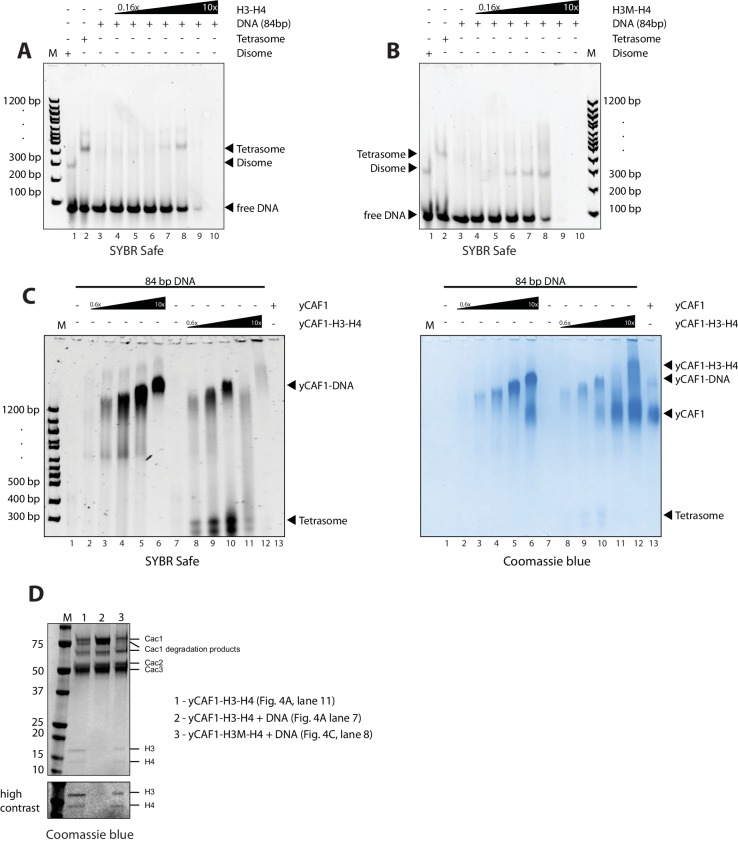
Figure 4—figure supplement 2. EMSA analysis of H3-H4 deposition.

Figure 4—figure supplement 2.

(A) EMSA showing tetrasome and (B) disome assembly controls. The position of migration of the dimsome, tetrasome and free DNA are indicated. The gels were stained with SYBR Safe or Coomassie stain as indicated. Increasing amounts of yCAF1-H3-H4 (0.2 μM to 10 μM in two fold steps) were mixed with 1 μM 84 bp DNA. (C) EMSA showing that yCAF1 binding to the 84 base pair DNA substrate migrates at the same position as yCAF1 that has released its H3-H4 cargo and subsequently bound to excess free DNA. All EMSA experiments were repeated at least two times with consistency. (D) Bands indicated by * in Figure 4A,C were extracted from the native PAGE gel and analyzed by SDS-PAGE followed by Coomassie blue staining. The bottom panel shows a high contrast rendering of the bottom part of the SDS-PAGE gel.