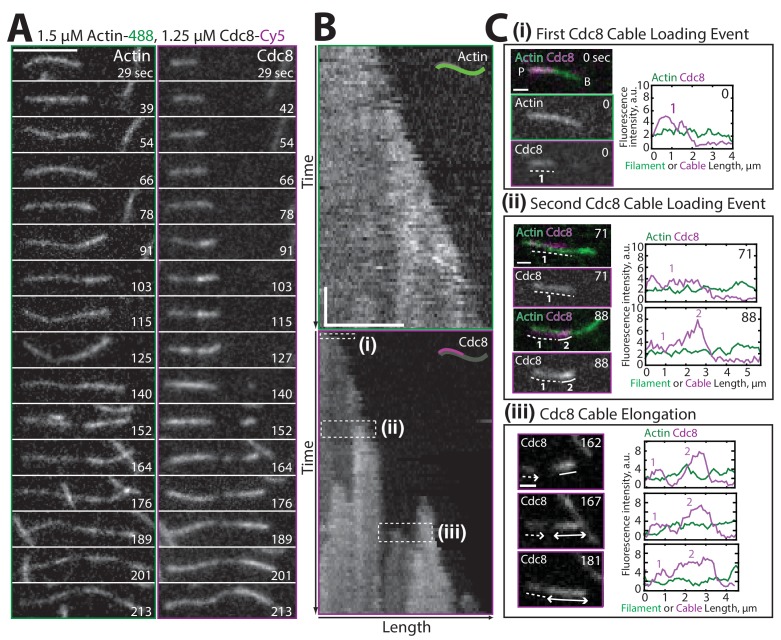
Figure 2. Two distinct Tropomyosin Cdc8 cables load cooperatively onto a single actin filament.
(A–B) Two-color TIRFM of 1.5 μM Mg-ATP actin (15% Alexa 488) with 1.25 μM tropomyosin Cdc8 dimer (Cy5-labeled). (A) Timelapse of an elongating actin filament (left) and Cdc8 loading and spreading events (right). Scale bar, 5 μm. (B) Kymograph of the elongating actin filament and associated Cdc8 events. The first Cdc8 cable loading event (i), second Cdc8 cable loading event (ii), and Cdc8 cable spreading event (iii) are boxed. Scale bar, 5 μm. Time bar, 30 s. (C) Fluorescent images and corresponding fluorescence intensity line scans of actin (green) and Cdc8 (magenta) from the boxed regions in (B). Scale bar, 1 μm. (Ci) A single Cdc8 cable on an actin filament segment. The dotted line (1) marks one Cdc8 cable on the actin filament segment. (Cii) A second Cdc8 cable loading event on an actin filament. Dotted (1) and solid (2) lines mark the first and second tropomyosin cables on the actin filament segment. (Ciii) A spreading Cdc8 cable. Arrows denote spreading direction of first (dotted line, 1) and second (solid line (2) Cdc8 cables. Scale bars, 1 µm.

