Figure 4. Modeling of Tropomyosin Cdc8 dynamics on growing actin filaments.
(Ai-iii) Two-color TIRFM of 1.5 μM Mg-ATP actin (15% Alexa 488) with 1.25 μM tropomyosin Cdc8 dimer (Cy5-labeled). (Ai-ii) Timelapse and corresponding kymograph of Cdc8 loading and spreading. The green line indicates the actin filament barbed end. Scale bar, 5 μm. (Aiii) Quantification of the fraction of F-actin coated by one (Single, checkered purple) or two (Double, solid purple) Cdc8 cables. Total coverage (purple line) is from initial quantification in Figure 1B. Hill=14.6. n = 2 reactions. (Bi-iii) Modeling of Cdc8 association with an actin filament with exclusively end-to-end interactions. (Bi) Lattice model schematic with parameters for actin elongation (vgrow), rates of association (kon, (a)) or dissociation (koff, (b)) of single Cdc8 molecules with the actin filament, and rates of association (kon*w (c), kon*w2) and dissociation (koff/w (d), koff/w2 (e)) at sites within a Cdc8 cable. (Bii) Kymograph of simulated loading and spreading of modeled Cdc8 under parameters in (Bi). The green line indicates the actin filament barbed end. (Biii) Quantification of simulated data from end-to-end cooperativity model. Hill=14.9. (Ci-iii) Modeling of Cdc8 association with an actin filament that includes both end-to-end interactions and indirect cooperativity. (Ci) Schematic of lattice model, which includes all parameters from (B) as well as additional parameters added for (C): rates of association (kon*c, (a)) and dissociation (koff/c, (b)) of Cdc8 molecules across from a site already bound by a Cdc8 molecule, and rates of association (koff*cw) and dissociation (koff/cw (c)) of Cdc8 molecules within a cable and across from an already-bound Cdc8. (Cii) Kymograph of simulated loading and spreading of modeled Cdc8 under parameters in (Ci). (Ciii) Quantification of simulated data from end-to-end with indirect cooperativity model. Hill=13.4.

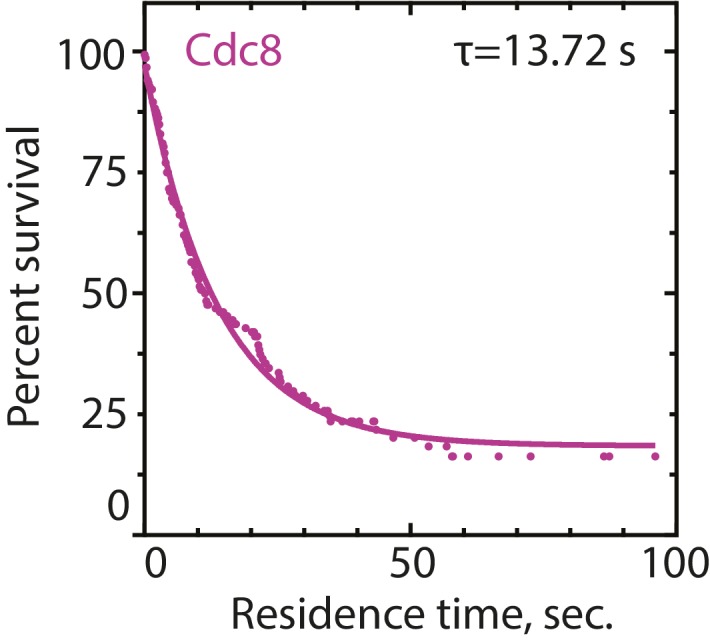
Figure 4—figure supplement 1. Residence time of tropomyosin Cdc8 on actin filaments.