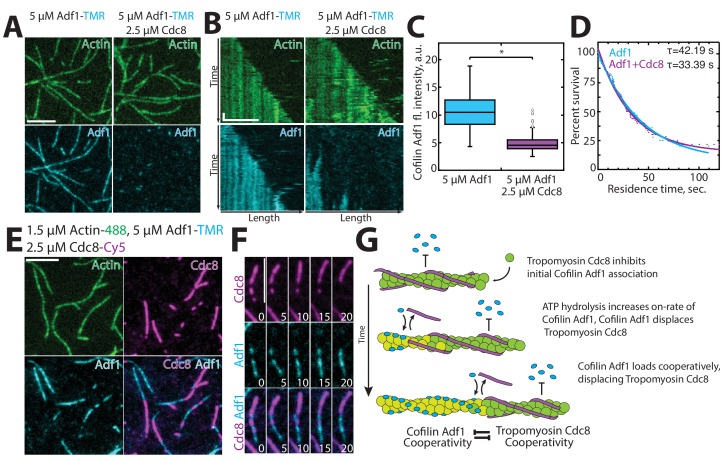
Figure 6. Tropomyosin Cdc8 inhibits initial binding of ADF/cofilin Adf1 to actin filaments.
(A–C) Two-color TIRFM of 1.5 μM Mg-ATP actin (15% Alexa 488 labeled) with 5 μM ADF/cofilin Adf1 (TMR-labeled) in the presence or absence of 2.5 μM tropomyosin Cdc8 (unlabeled). (A) Micrograph of Adf1 association with actin filaments in the absence or presence of Cdc8. (B) Kymograph of an elongating actin filament (top) and associated Adf1 (bottom) in the absence or presence of unlabeled Cdc8. Scale bar, 5 μm. Time bar, 30 s. (C) Box plot of average Adf1 fluorescence intensity on actin filaments in the absence or presence of unlabeled Cdc8. Open circles indicate outliers. Two-tailed t-test for data sets with unequal variance yielded *p-value: 6.77 × 10−82. n ≥ 145 measurements. (D) Residence time of single Adf1 (TMR-labeled) molecules in the absence or presence of unlabeled Cdc8. n ≥ 81 events. (E–F) Three-color TIRFM of 1.5 μM Mg-ATP actin (15% Alexa 488 labeled) with 5 μM Adf1 (TMR-labeled) and 2.5 μM Cdc8 (Cy5-labeled). (E) Micrograph of actin filaments associated with Adf1 and Cdc8. Scale bar, 5 μm. (F) Timelapse of Adf1 association with an actin filament, and subsequent dissociation of Cdc8. Scale bar, 5 μm. Time in sec. (G) Cartoon model of how Cdc8 and Adf1 affect each other’s association with F-actin.


