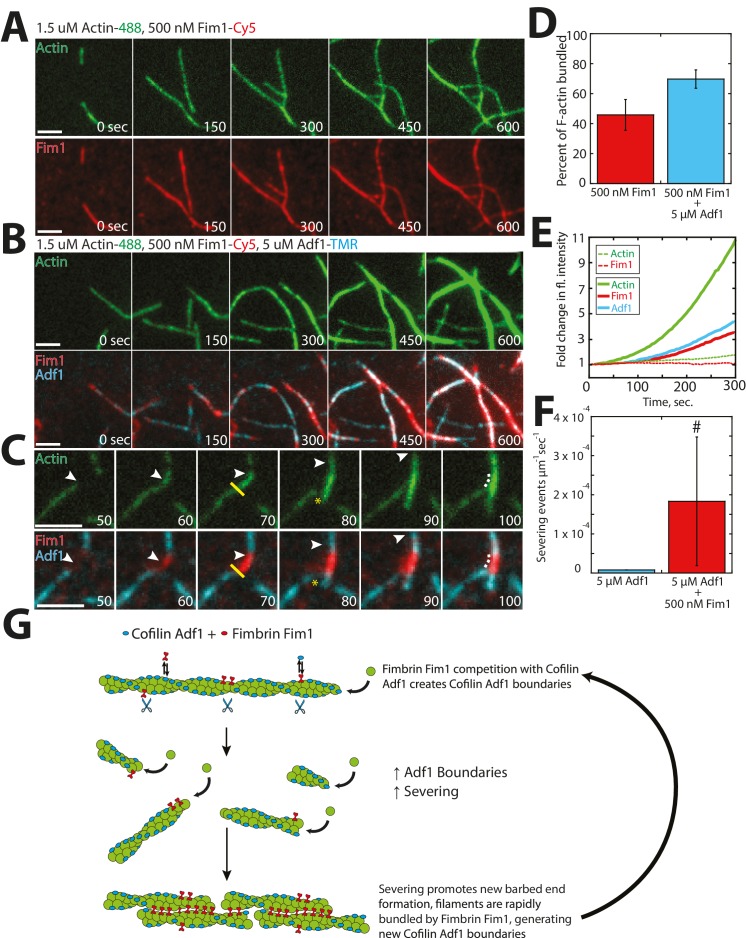
Figure 7. Fimbrin Fim1 and ADF/cofilin Adf1 competition generates a dense F-actin network.
(A) Timelapse of two-color TIRFM of 1.5 μM Mg-ATP actin (15% Alexa 488-labeled) with 500 nM fimbrin Fim1 (Cy5-labeled). (B) Timelapse of three-color TIRFM of 1.5 μM Mg-ATP actin (15% Alexa 488-labeled) with 500 nM Fim1 (Cy5-labeled) and 5 μM ADF/cofilin Adf1. (C) Timelapse showing severing at the boundary between a Fim1-mediated bundle and a single actin filament. White arrow indicates the elongating actin filament barbed end. A yellow line and asterisk indicate the severing site and severing event, respectively. (D) Quantification of percent of total actin filaments bundled with Fim1 alone or Fim1 and Adf1. Error bars represent standard deviation of the mean; n = 2 reactions. (E) Fold-change over time in total fluorescence intensity for either actin (dotted green line) and Fim1 (dotted red line) in the absence of Adf1, or for actin (solid green line), Fim1 (solid red line), and Adf1 (solid blue line) in the presence of Adf1. (F) Severing rate of high concentrations of Adf1 alone or in the presence of Fim1. # indicates under-reporting, as severing events could not be measured on dense bundles. Error bars represent standard deviation of the mean; n = 2 reactions. (G) Cartoon model of how Adf1 and Fim1 influence each other’s interactions with actin and affect F-actin network formation.

