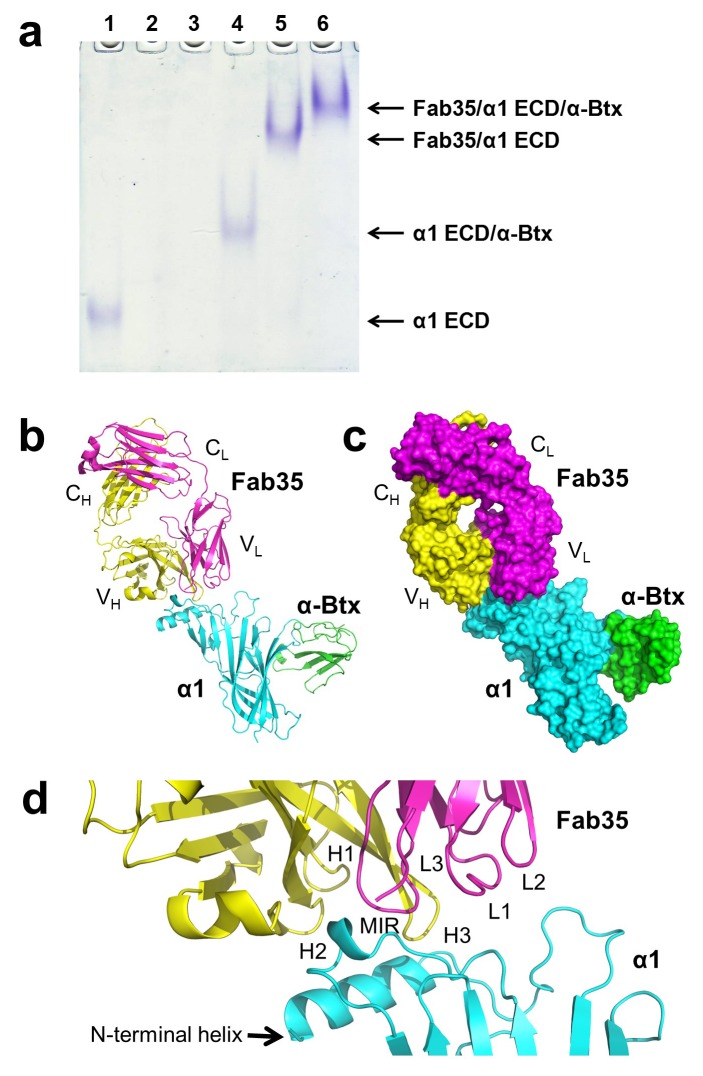
Figure 1. The ternary complex of nAChR α1 ECD bound by Fab35 and α-Btx.
(a) Gel shift assay. Native PAGE showed the formation of the ternary complex of nAChR α1 ECD, α-Btx and Fab35. Lane 1: nAChR α1 ECD alone (labeled as α1 ECD), Lane 2: α-Btx alone, Lane 3: Fab35 alone, Lane 4: nAChR α1 ECD plus α-Btx, Lane 5: nAChR α1 ECD plus Fab35, and Lane 6: nAChR α1 ECD plus α-Btx plus Fab35. Note that α-Btx in Lane 2 and Fab35 in Lane 3 were not visible because both proteins migrated upward due to their net positive charges under the experimental condition. (b) Ribbon representation of nAChR α1 ECD (α1: cyan) bound by α-Btx (green) and Fab35 (heavy chain, H: yellow and light chain, L: magenta). The variable domains (VH and VL) and the constant domains (CH and CL) of Fab35 are indicated accordingly. This color scheme is kept the same throughout illustration unless noted otherwise. (c) Surface representation of the ternary complex. (d) Zoomed-in view of the binding interface. The complementarity determining regions (CDRs) of the heavy chain (CDR-H1, CDR-H2, and CDR-H3) are indicated as H1, H2, and H3, respectively. Those of the light chain (CDR-L1, CDR-L2 and CDR-L3) are indicated as, L1, L2, and L3, respectively.


