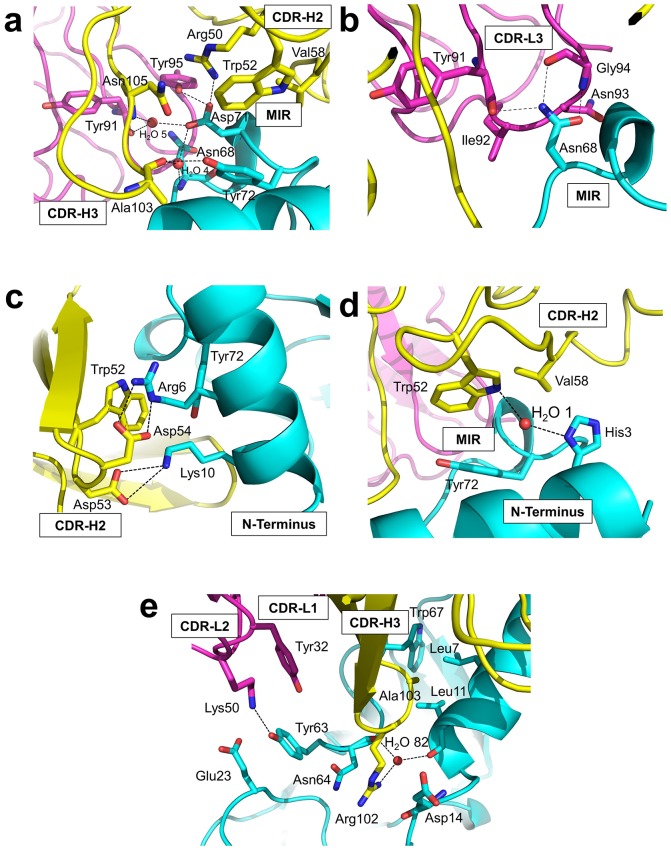
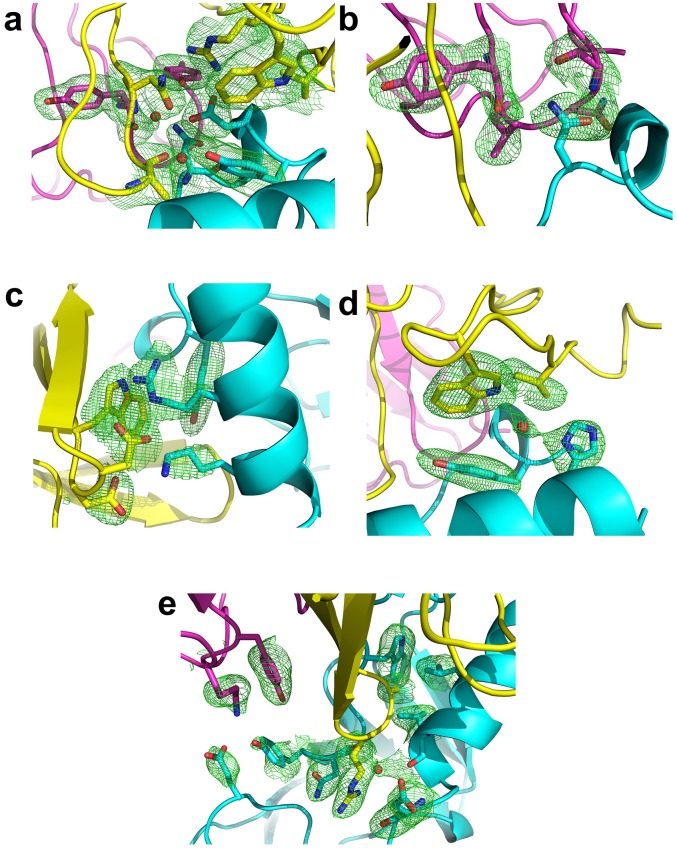
Figure 3. Detailed interactions at the interface between Fab35 and nAChR α1 ECD.
(a) Binding interactions at the Asp71 site of α1 (located at the MIR). (b) Binding interactions at the Asn68 site of α1 (located at the MIR). (c) Binding interactions surrounding Arg6 and Lys10 of α1 (located at the N-terminus of α1). (d) Binding interactions mediated by His3 of α1 (located at the N-terminus of α1). (e) Binding interactions at the CDR-H3 loop of Fab35. Interacting residues are represented by stick model and are colored according to their protein subunits. Water molecules are represented by red spheres.


