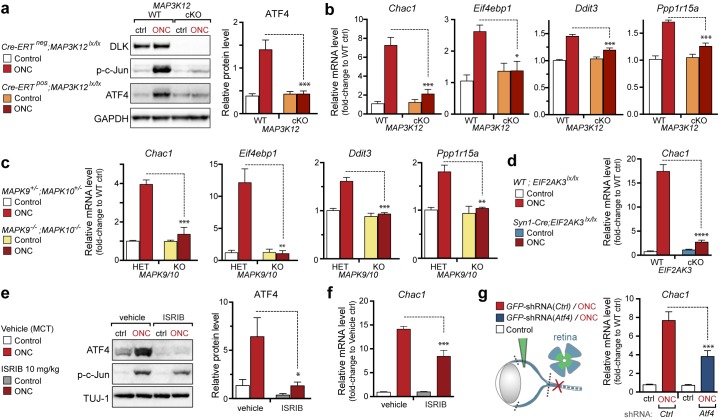
Figure 7. DLK/PERK signaling regulates ATF4 target gene Chac1 mRNA following optic nerve crush.
(a–b) DLK-deficient (CAG-ERTpos;Map3k12lx/lx, DLK cKO) mice exhibit reduced activation of the ISR and JNK pathway following ONC compared to controls (CAG-ERTneg;Map3k12lx/lx). (a) DLK-deficient retina lysates 3 d after ONC display no induction of ATF4 protein by immunoblot (n = 4/condition). (b) qRT-PCR of ISR-associated genes in retina following ONC in DLK cKO mice compared to Cre-negative controls (n = 5–6/ condition). (c) qRT-PCR of ISR-associated genes in retina following ONC (red) in JNK2/3-deficient mice (n = 5–6/condition). (d) Induction of Chac1 mRNA is suppressed in PERK cKO retinas (Syn1-Cre;Eif2ak3lx/lx mice) compared to Cre-negative littermates following ONC (n = 6). (e) Dosing with ISRIB reduces upregulation of ATF4 protein in mouse retinal lysates 16 h post-ONC (immunoblot and quantification, n = 4/condition, 2.5 mg/kg ISRIB b.i.d.). (f) Chac1 mRNA (qPCR, n = 4/condition) in mouse retina 48 h post-ONC (10 mg/kg ISRIB b.i.d.). (g) Intravitreal injection of an AAV2 vector directing expression of GFP and an shRNA targeting mouse Atf4, GFP-shRNA(Atf4), reduces Chac1 mRNA induction following ONC in transduced regions of the retina compared to a similar AAV2 vector with a non-targeting shRNA sequence, GFP-shRNA(Ctrl) (see Materials and methods, qPCR, n = 8/condition). One-way ANOVA with Bonferroni’s post-hoc test was used for statistical analysis. Data are mean ± SEM. *p<0.05, **p<0.01, ***p<0.001, ****p<0.0001.
Figure 7—figure supplement 1. Quantification of p-c-Jun immunoblots presented in Figure 7a (DLK-deficient retina lysates three days after ONC, n = 4/condition).
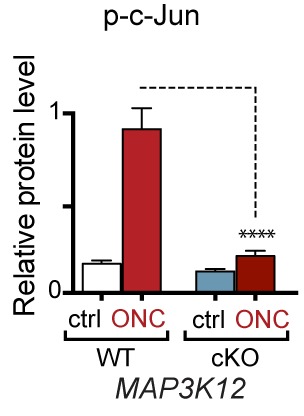
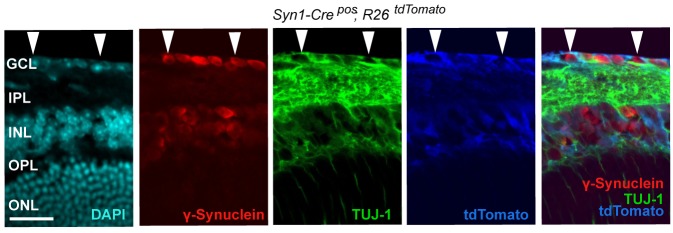
Figure 7—figure supplement 2. Syn1-Cre activity in the retina, illustrated by Syn1-Cre;R26LSL.tdTomato (blue) expression co-localizing with TUJ-1 (green) and γ-synuclein (red) immunolabeled RGCs in the GCL.
Figure 7—figure supplement 3. Quantification of p-c-Jun immunoblots presented in Figure 7e (ONC in mice dosed with ISRIB).
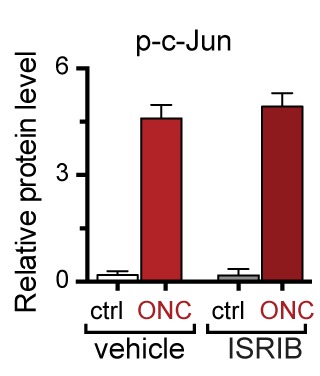
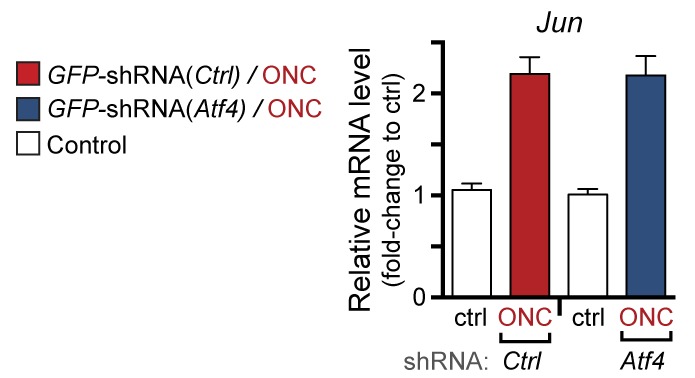
Figure 7—figure supplement 4. qPCR of Jun mRNA following ONC in AAV2-shRNA-GFP-injected mice (corresponding to Figure 7g).
