Figure 2. Stella is associated with the activation of essential zygotic genes.
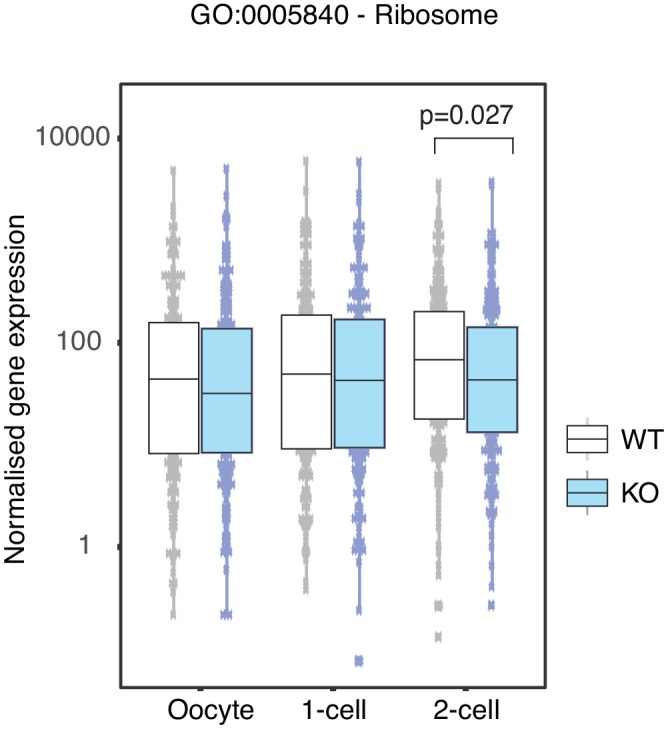
(A) Revigo plots (Supek et al., 2011) of a selection of gene ontology (GO) terms enriched in 2-cell DEG (Figure 2—source data 1). The colour of the circle represents the log10 p-value. Semantic space clusters GO terms of similar functions together. (B) A boxplot of normalised counts of genes belong to the Ribosome KEGG pathway between WT and KO across the developmental stages. Two-sided Wilcoxon rank sum test performed between WT and KO and statistically significant p-value is stated. (C and D) shows boxplots of single-embryo qRT-PCR validation of RNA-seq in WT (white) and KO (light blue) 2-cell embryos. All genes are normalised to housekeeping genes, relative to one WT embryo and log2 transformed. (C) shows genes significantly upregulated and (D) downregulated in KO relative to WT 2-cell embryos (p<0.05 = *; p<0.01 = **, p<0.001 = *** and p<0.0001 = ****). (E) A table of the top 10 GO terms enriched in 710 genes whose expression levels are positively correlated with Dppa3 (Pearson’s correlation coefficient >0.9), identified from the genome-wide co-expression network analysis (Figure 2—source data 2). (F) Scatter plots of the expression of Snrpd1 and Snrpb2 against Dppa3. Gene expression was log2 transformed (counts per million + 1) and Pearson’s correlation analysis was performed. Also see Figure 2—figure supplement 1 and Figure 2—source data 1–2.
DOI: http://dx.doi.org/10.7554/eLife.22345.010

Figure 2—figure supplement 1. Ribosome associated genes are depleted in Stella M/Z KO 2-cell embryos.