. 2017 Mar 27;6:e22964. doi: 10.7554/eLife.22964

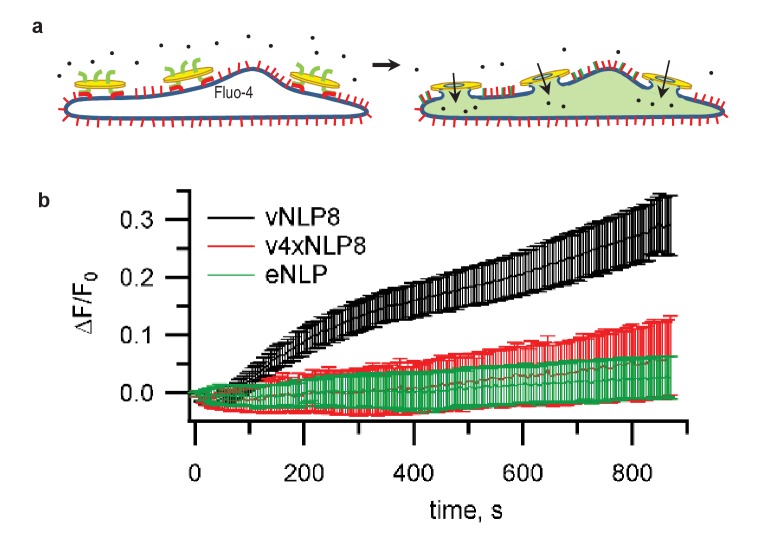
Figure 3. Calcium-influx assay.

(a) Schematic of the assay. (b) tCells were loaded with the Ca2+ indicator Fluo-4, whose fluorescence was imaged as a function of time. Opening of fusion pores allowed Ca2+ influx into the cytosol, causing the Fluo-4 signal to increase for vNLP8 (10 dishes), but not for v4xNLP (six dishes) or eNLP (four dishes) samples. The fluorescence from the entire viewfield for each dish was averaged. Displayed errors are S.E.M.

DOI: http://dx.doi.org/10.7554/eLife.22964.006

Figure 3.

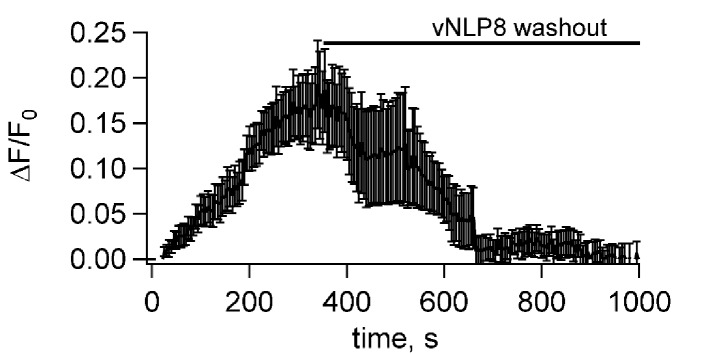
Figure 3—figure supplement 1. Fusion pores connecting NLPs to cells eventually close.

Figure 3—figure supplement 1.

Flipped t-SNARE cells were loaded with the Ca2+ indicator Fluo-4, whose fluorescence was imaged as a function of time after addition of NLPs bearing eight copies of VAMP2, as in Figure 3. Opening of fusion pores allowed Ca2+ influx into the cytosol, causing the Fluo-4 signal to increase. To test whether the pores eventually closed, free NLPs were washed out after 5 min, as indicated. This caused the Fluo-4 signal to return to baseline within a few minutes, indicating that pores eventually closed. Data from six dishes; error bars are S.E.M.