. 2017 Mar 27;6:e22964. doi: 10.7554/eLife.22964

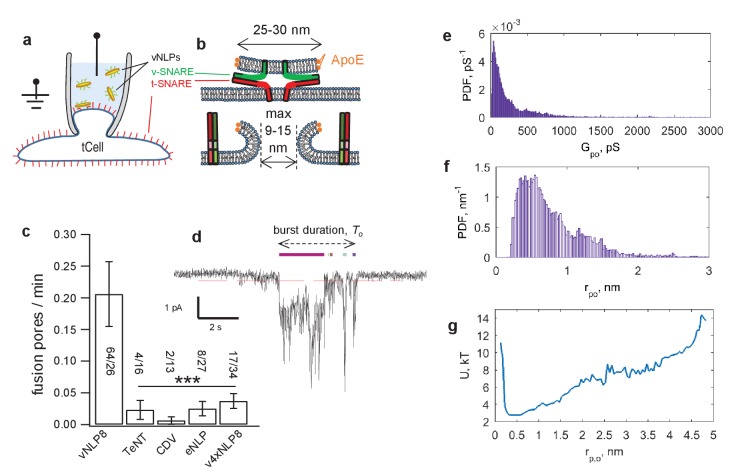
Figure 4. Detection of single-pores between vNLP nanodiscs and tCells.

(a, b) Schematic of the assay. A glass pipette seals a patch on the tCell membrane. The pipette solution includes NLPs. When a vNLP fuses with the tCell membrane (b), a nm-sized pore opens and connects the cytosol to the pipette solution. Thus, currents through voltage-clamped pores report fusion and pore properties with sub-ms time resolution. In (b), the bilayers, the SNAREs and the NLP are drawn approximately to scale. The light, medium and dark shades of green and red indicate the transmembrane, linker, and SNARE domains of the v- and t-SNAREs, respectively. (c) Pores are SNARE-induced. When empty NLPs (eNLPs), the cytoplasmic domain of VAMP2 (CDV), the tetanus neurotoxin light chain (TeNT), or NLPs loaded with the docking-competent, fusion-incompetent VAMP2-4X mutant (v4xNLP8) were used, only a very low level of current activity was recorded compared to the currents resulting from NLPs loaded with ~eight copies of wild-type v-SNAREs. The number of pores/patches are indicated for each condition. (*** indicates p<0.001, t-test against vNLP8). (d) An example of a fusion pore current ‘burst’. Fusion leads to fluctuating and flickering currents that are well separated in time from one another. A threshold (red dotted line) and a minimum crossing time are imposed to define pore open periods (Materials and methods and Wu et al., [2016]). Detected sub-openings are indicated with colored bars above the current trace. (e) Average probability density function (PDF) of open-pore conductances. (f) Averaged PDF of open-pore radii. Data are from 61 fusion pores, 26 cells. (g) Free energy profile calculated from the distribution of pore sizes in (f). Distributions of flicker numbers per pore and burst lifetimes are shown in Figure 4—figure supplement 1. Additional examples of current bursts are provided in Figure 4—figure supplement 2.

DOI: http://dx.doi.org/10.7554/eLife.22964.008

Figure 4.

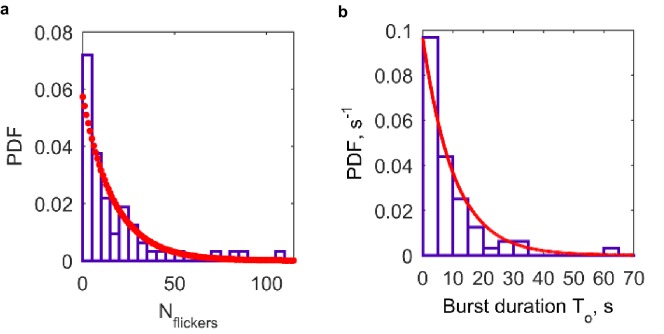
Figure 4—figure supplement 1. Additional properties of single fusion pores connecting NLPs loaded with eight copies of VAMP2 and flipped t-SNARE cells (64 pores from 26 cells).

Figure 4—figure supplement 1.

(a) Distribution of flicker numbers, and fitted geometric distribution. The red dots are a fit to a geometric distribution,  y=p(1p)n, n=0,1, 2, 3,... with p=0.0573 (95% confidence interval: 0.0437, 0.0709). Mean ± S.E.M. was 16 ± 2.7 flickers. (b) Distribution of burst lifetimes, T0, as defined in (d), and exponential best fit (red curve). Mean ± S.E.M. = 10.3 ± 2.2 s.
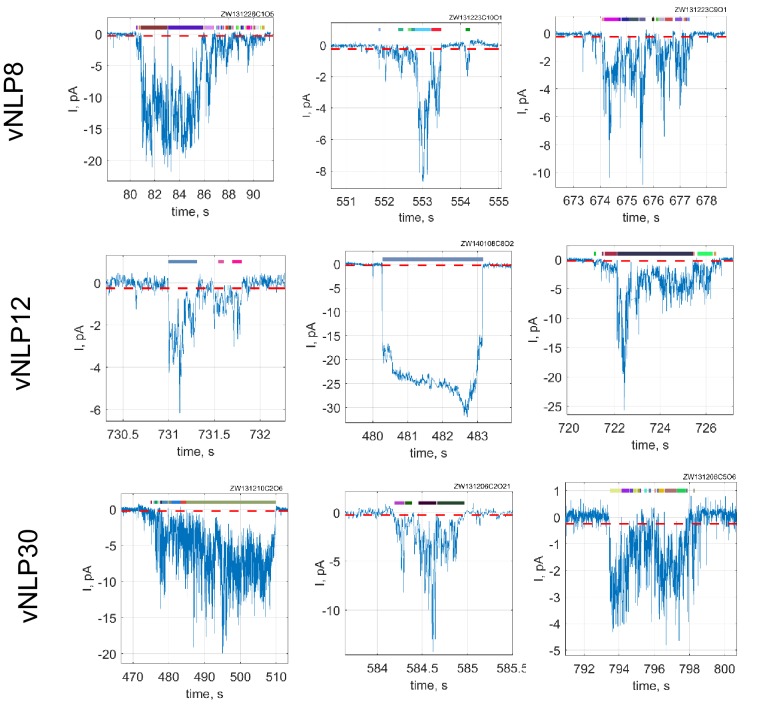
Figure 4—figure supplement 2. Additional examples of current bursts.

Figure 4—figure supplement 2.

Red dashed lines indicate −0.25 pA threshold. During a burst, a pore is considered open if it crosses this threshold for at least 15 consecutive points (60 ms). Detected open sub-periods are indicated by colored bars above the traces.
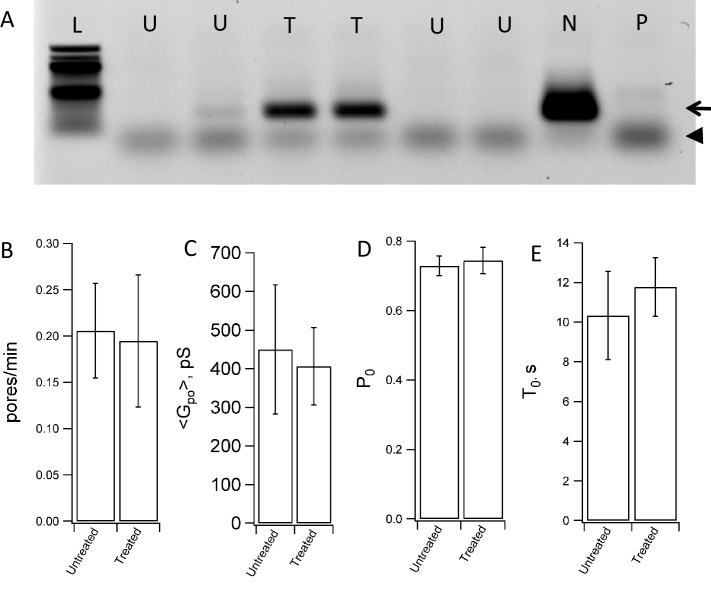
Figure 4—figure supplement 3. Mycoplasma contamination does not affect fusion with NLPs.

Figure 4—figure supplement 3.

(A) Testing of flipped t-SNARE cells for mycoplasma contamination. Mycoplasma-negative control (lane marked N) shows the internal control band at 479 bp (arrow). The positive control (lane marked P) shows a band at 270 bp (arrowhead) and an additional band of the internal control at 479 bp. The 479 bp internal control DNA of the detection kit fades with increased number of amplicons formed from mycoplasma DNA. Lane L is the ladder, lanes marked U test untreated flipped t-SNARE cells, and lanes marked T test flipped t-SNARE cells treated with an anti-mycoplasma agent. Anti-mycoplasma treatement reduced contamination substantially. (B–E) Fusion between NLPs bearing eight total copies of v-SNARE (vNLP8) and flipped t-SNARE cells that were either untreated or treated for mycoplasma contamination. The rate at which pores appear (B), the mean pore conductance (C), the pore open probability during a burst (D) and the pore lifetime (E) are indistinguishable for untreated vs. mycoplasma-treated cells. 64 pores from 26 patches were recorded from untreated cells and 51 pores from 21 patches were recorded from treated cells.