. 2017 Mar 27;6:e22964. doi: 10.7554/eLife.22964

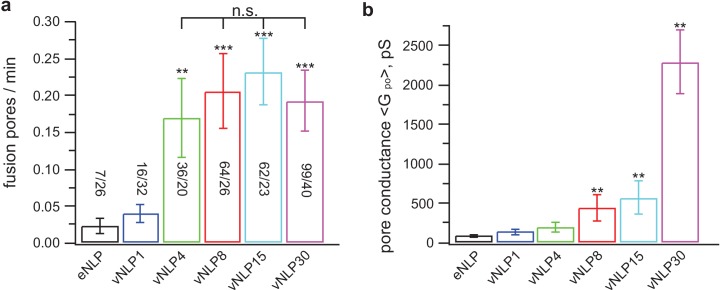
Figure 5. Only a few SNARE complexes are required to nucleate a pore, but more than ~15 are required to dilate it.

( a) Pore nucleation rate as a function of total v-SNARE copy number per NLP. Copy numbers per NLP face are approximately 0, 1, 2, 4, 7.5, and 15 for eNLP and vNLP1 through vNLP30, respectively. Pore nucleation requires ~two copies per NLP face and saturates at two to four copies per NLP face. n.s. indicates no statistically significant differences for the mean fusion rates among vNLP4, vNLP8, vNLP15, and vNLP30 samples, as assessed by an analysis of variance (ANOVA) and multiple pairwise comparisons of the group means. The source and analysis files are provided as Figure 5—source data 1. (b) Mean single-pore conductance, Gpo as a function of number of v-SNARE copies loaded into NLPs. Gpo increases rapidly as increasing numbers of v-SNAREs are loaded per NLP. At the maximum value tested, ~15 copies per NLP face, Gpo is far from saturating. The number of pores analyzed/total number of cells is indicated for each condition in (a). **, *** indicate p<0.01 and 0.001, respectively, using the two-sample t-test (a) or the Kolmogorov-Smirnov test (b) to compare with eNLP. Additional pore properties are shown in Figure 5—figure supplement 1. Properties of pores induced using lipid-anchored v-SNAREs are shown in Figure 5—figure supplement 2.

DOI: http://dx.doi.org/10.7554/eLife.22964.012

Figure 5—source data 1. Statistical analysis of fusion rates reported in Figure 5a.
Multiple pairwise comparisons of the group means were performed using 1-way analysis of variance (ANOVA) and a multiple comparison test using Matlab. The zipped file includes a matlab file (Figure 5a_FusionPoresPerMin_vs_vNLPcopies.mat) containing the fusion rate data and the results of the ANOVA and multiple comparison tests. Three figures summarize the test results (Figure 5a_ANOVAtable.fig, Figure 5a_ANOVAboxplot.fig, and Figure 5a_multcompare.fig). The analysis procedure and the results are explained in the pdf file Figure 5a_FusionRateAnalysis_summary.pdf.
DOI: 10.7554/eLife.22964.013

Figure 5.

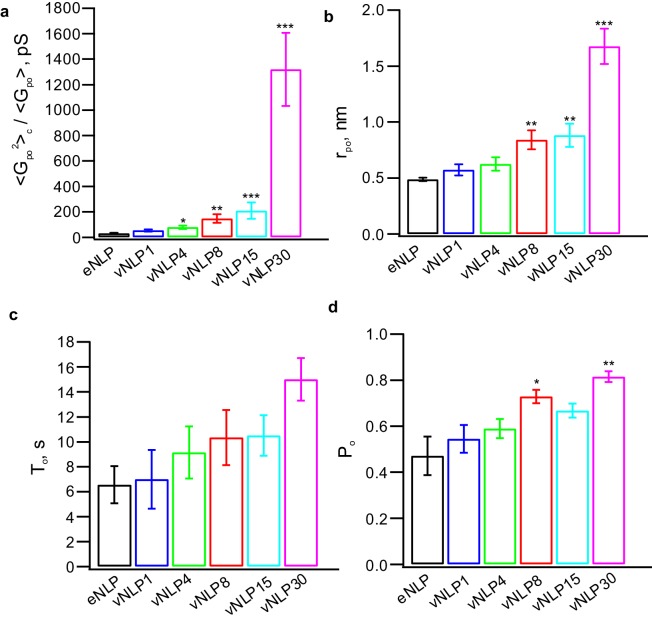
Figure 5—figure supplement 1. Additional pore properties as a function of v-SNARE copy number per NLP.

Figure 5—figure supplement 1.

(a) Conductance fluctuations relative to mean Gpo2/Gpo. (b) Mean open-pore radii rpo. (c) Pore lifetime, To. (d) Burst open probability Po. eNLP, empty (SNARE-free) NLPs. The numbers in vNLP1 through vNLP30 indicate the total v-SNARE copy numbers per NLP. *, **, *** indicate p<0.05, 0.01, and 0.001, respectively, using the Kolmogorov-Smirnov test to compare with eNLP.
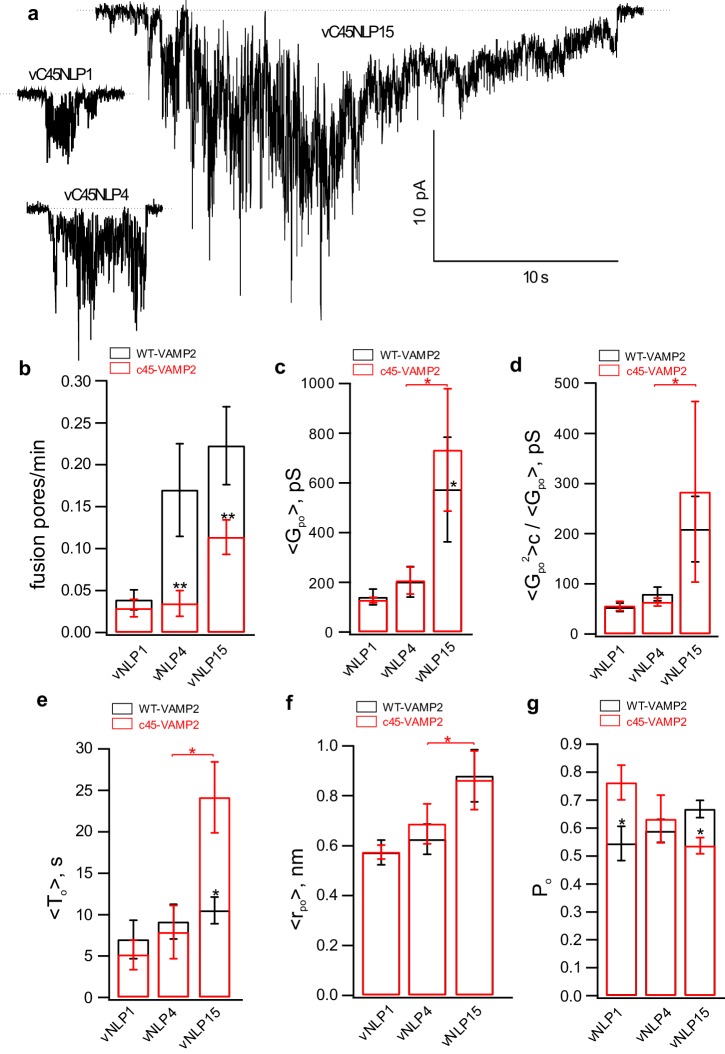
Figure 5—figure supplement 2. Larger numbers of lipid-anchored v-SNAREs promote pore dilation.

Figure 5—figure supplement 2.

(a) Sample traces for NLPs loaded with different copy numbers of lipid-anchored VAMP2. (b–g) Fusion pore properties of lipid-anchored (red) and wild-type (black) v-SNARE NLPs (see legend of Figure 5—figure supplement 1 for parameter definitions). Replacing VAMP TMD with a C45 lipid anchor reduced the rate of pore nucleation (b) but made nucleation events last longer (e), consistent with previous results using smaller MSP NDs (Wu et al., 2016). Overall trends as a function of copy number were similar for all parameters for C45 and WT vNLPs. The number of pores/patches were 90/63, 12/30, and 11/29 for vC45NLP15, vC45NLP4, and vC45NLP1, respectively.
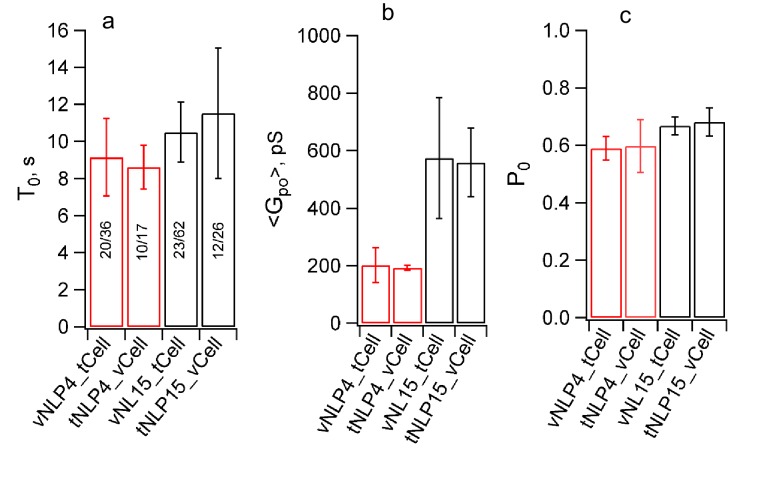
Figure 5—figure supplement 3. Swapping the locations of the v- and t-SNAREs does not affect pore properties.

Figure 5—figure supplement 3.

Flipped v-SNARE cells were fused with t-SNARE NLPs (loaded with 4 or 15 total copies of t-SNAREs, tNLP4 and tNLP15), inverting the target membrane. For a given SNARE copy number in NLPs, burst lifetime (a), mean open-pore conductance (b), and probability that a pore is open during a burst were indistinguishable between the vNLP_tCell and tNLP_vCell configurations. The number of patches/pores are indicated for each condition in (a). The same numbers apply to (b) and (c). For vNLP_tCell fusion, results are copied from Figure 5 and Figure 5—figure supplement 1 to facilitate comparison.
Figure 5—figure supplement 4. Permeability of pores to NMDG+.
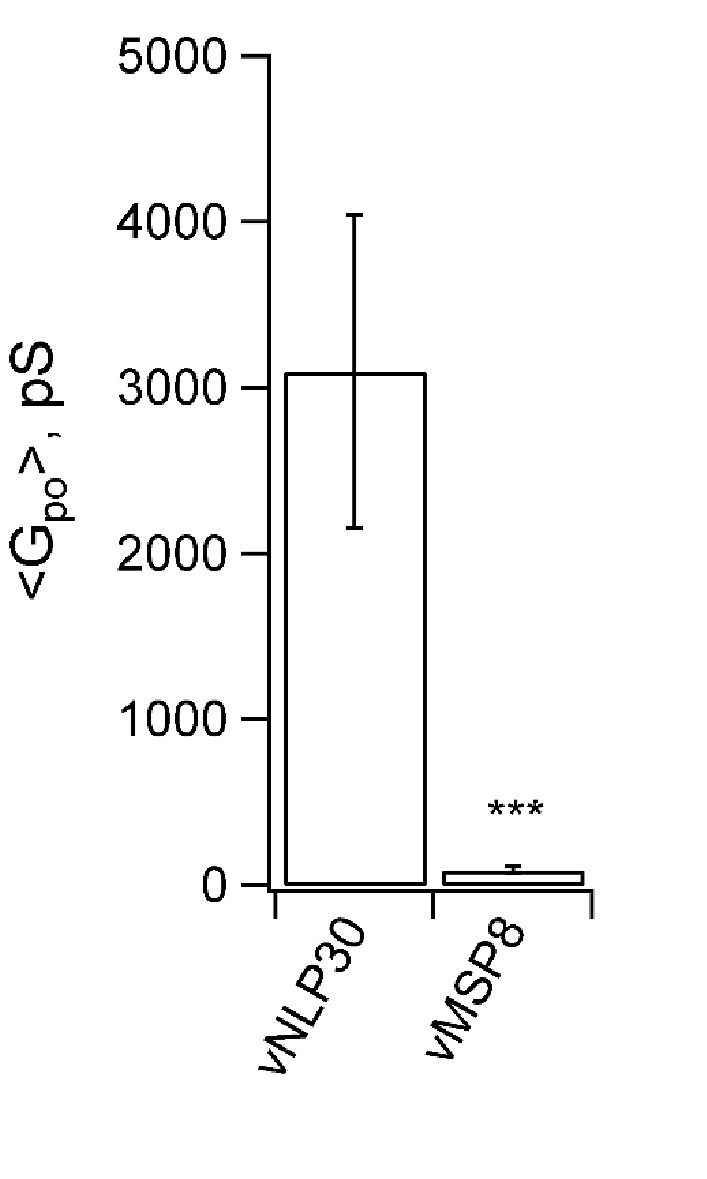
Figure 5—figure supplement 4.

Sodium in the pipette solution was replaced with N-methyl-D-glucamine (NMDG+), a large ion of ~1.1×0.5 nm in size without its hydration shell (Melikov et al., 2001), to test its passage through the fusion pores. Conductance was low when ~15 nm MSP nanodiscs with eight copies of v-SNAREs (vMSP8) were used (Wu et al., 2016), but not affected when ~23 nm NLPs bearing 30 v-SNAREs were employed (vNLP30). This suggests the increase in mean pore conductance that occurs as SNARE copy numbers are increased (Figure 5b) is due to pores becoming larger, and not to the appearance of multiple small pores. *** indicates p<0.001 (two-sample Kolmogorov-Smirnov test).