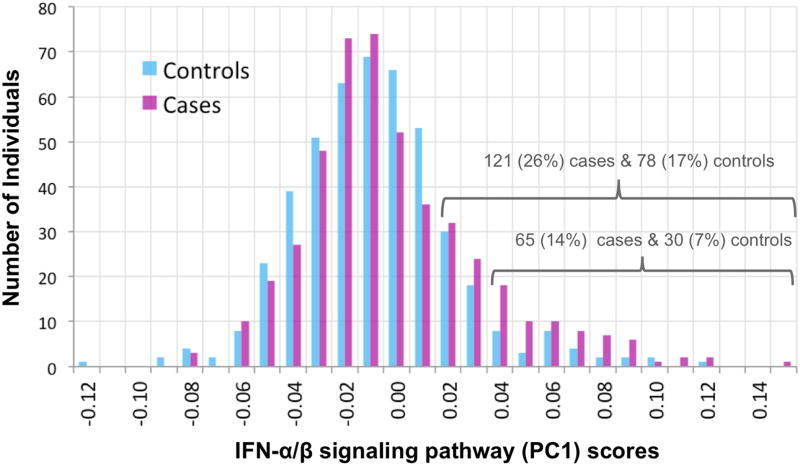
Figure 1. IFN-α/β signaling pathway PC1 scores.
Shown are the distributions of values of a score that summarizes expression levels of genes in the interferon -α/β signaling pathway for cases (magenta) and controls (cyan). Each bar indicates the number of individuals with a score between the X-axis value and the next higher value. Scores were computed as PC1 from Principal Components Analysis of normalized read counts for the 20 genes (shown in Table 3) in the pathway with p<0.05 for association with MDD individually (among the 49 genes, of 64 in the pathway, that passed the inclusion criterion of ≥10 total reads in ≥100 individuals). GSEA identified a significant association (0.05 FDR) between interferon α/β pathway gene expression and MDD (note that GSEA uses expression data for all genes, and not the summary PC1 score which is shown in this figure). There is an excess of cases with higher scores, as shown by the numbers over the brackets. Raw read counts were initially corrected for technical and biological covariates (Table S1: specimen-specific sequencing variables, RNA quality, white cell type proportion estimates, time of blood draw). Analysis of case-control difference included additional covariates (see Methods) including medication and substance classes seen in ≥30 subjects (Tables 2 and S2). Case scores were not predicted by clinical variables or childhood trauma scores (Supplementary Results). Case-control differences and enrichment of top gene subsets for this pathway were not explained by excluding 92 individuals with rarer medical diagnoses or medications, estimating white cell type proportions by a second method, controlling for intake of three anti-depressant classes, or controlling for substance abuse/dependence or steroid medications.

