
Figure 1.
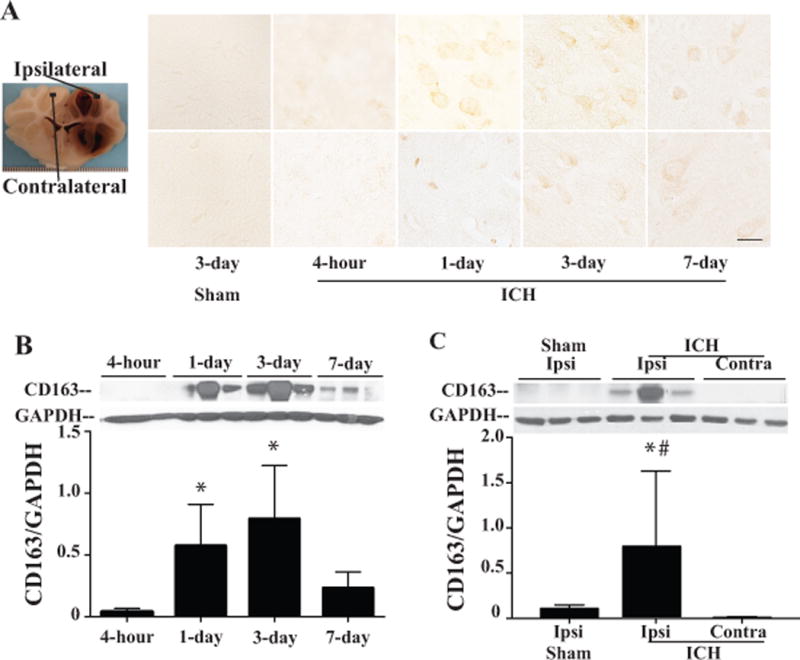
Time course of CD163 immunoreactivity (A) and protein levels (B) in the ipsilateral and contralateral grey matter after 2.5ml of autologous blood injected into the right frontal lobe. Scale bar=50μm. Values are mean ±SD, * p<0.05 vs. 4 hours. (C) Protein levels of CD163 in the ipsi- and contralateral grey matter after ICH, and in ipsilateral grey matter after sham operation at day 3. Values are mean ±SD, *p<0.05, vs. the ipsilateral side of sham, # p<0.01 vs. the contralateral side of ICH.