
Figure 4.
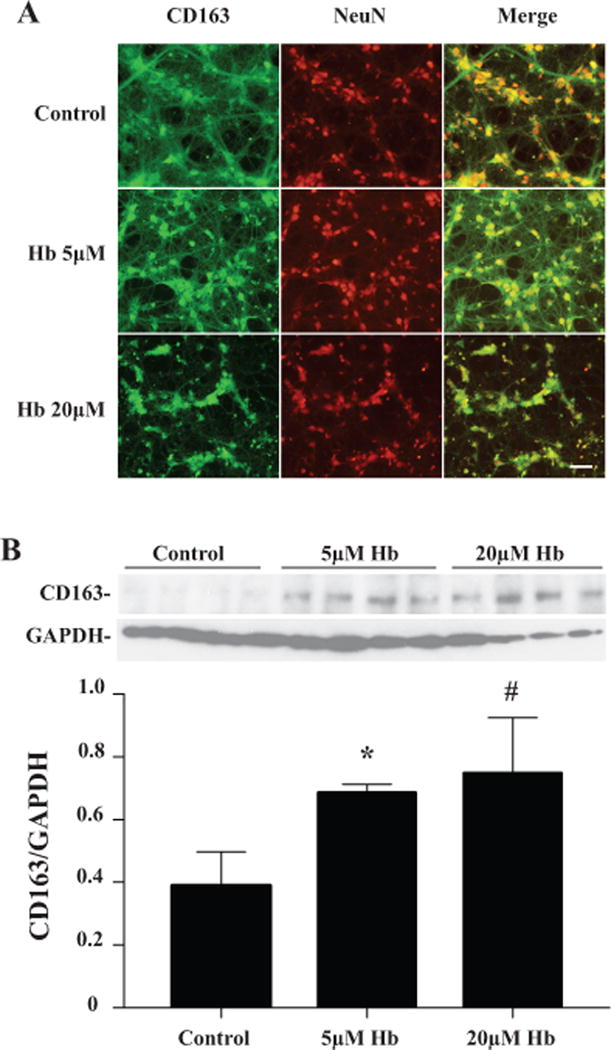
(A) Double labeling of CD163 and NeuN in primary cultured neuron treated with 0 (control), 5 or 20μM hemoglobin for 24 hours. Scale bar = 50μm. (B) Quantification of CD163 protein levels after hemoglobin exposure by Western blot. Values are mean ±SD, n=4, *p<0.05, #p<0.01 vs. the control.