
Figure 5.
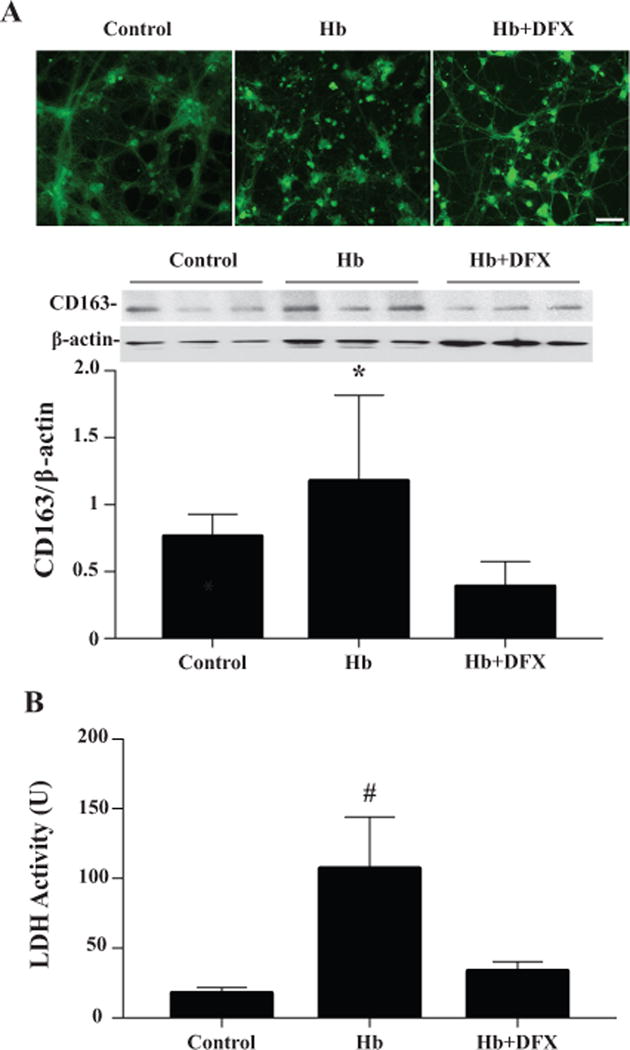
(A) CD163 immunoreactivity and protein levels in primary cultured neurons treated with hemoglobin (0 or 20μM) with or without deferoxamine (5μM) pretreatment. Scale bar= 50μm. (B) Media LDH levels 24 hours after the treatment of hemoglobin (0 or 20μM) with or without deferoxamine (5μM). Values are mean ± SD, *p<0.05, # p<0.01 vs. the other groups.