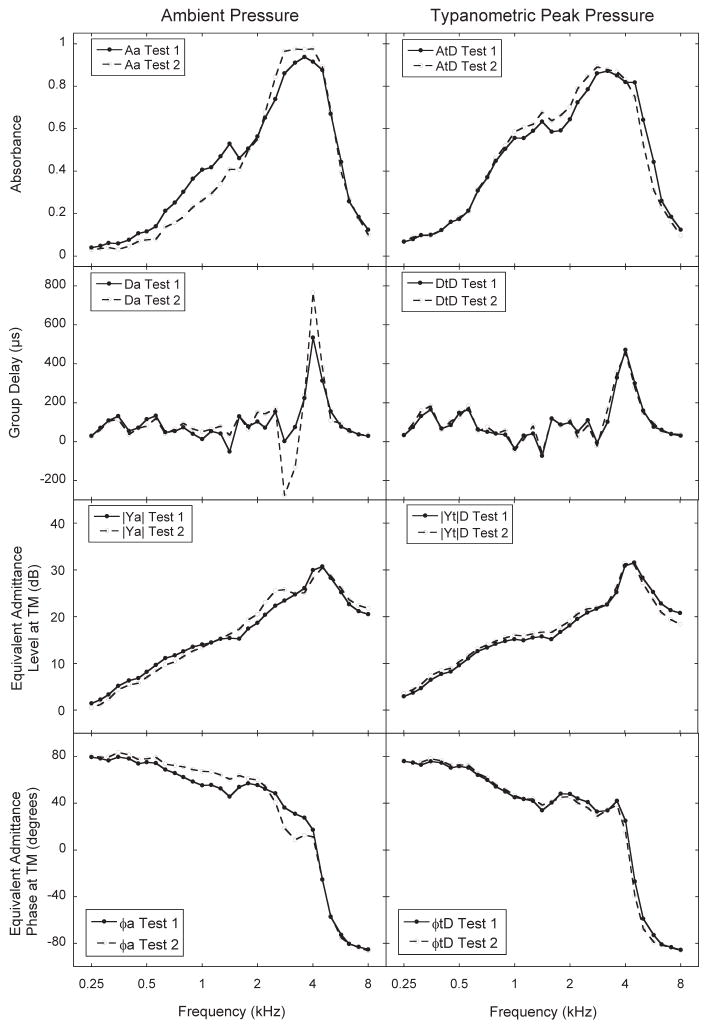
Figure 11.
Individual data for one subject in this study for both study visits. The left column shows data obtained for test one and test two (one week later) obtained at ambient pressure in the ear canal, and the right column shows data for the two tests obtained at tympanometric peak pressure for the downswept tympanogram, the pressure at which the maximum of the low-frequency averaged absorbance occurred over the frequency range from 0.376 to 2.0 kHz. This was +5 daPa for test one and −40 daPa for test two. The top panels show data for the wideband absorbance at ambient pressure (Aa) and TPP for the downswept tympanogram (AtD), the second row of panels shows data for group delay at ambient pressure (Da) and TPP for the downswept tympanogram (DtD, the third row shows data for equivalent admittance magnitude at the TM at ambient pressure (|Ya|) and TPP for the downswept tympanogram (|Yt|D); and the bottom row shows equivalent phase at the TM at ambient pressure (ϕa) and at TPP for the downswept tympanogram (ϕtD).

