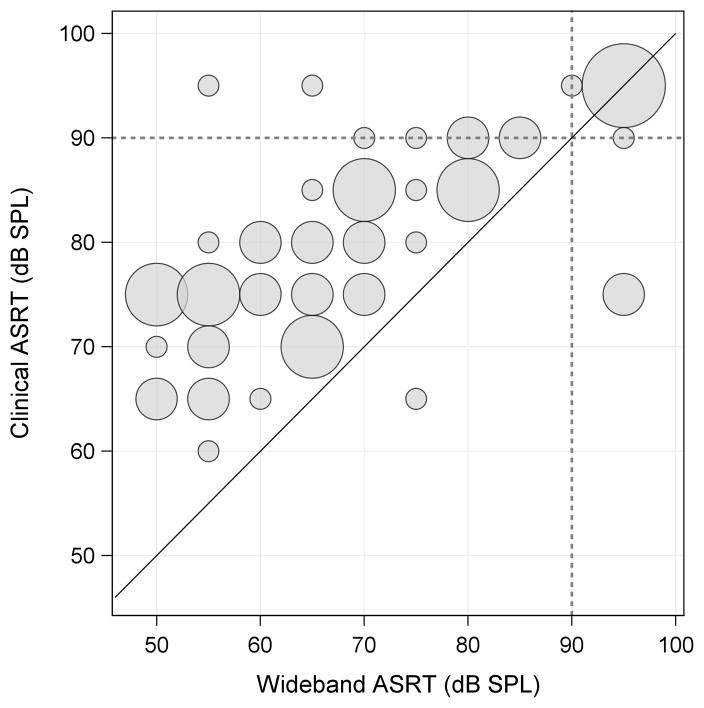
Figure 12.
Plot of wideband ASRT on the X axis versus the clinical ASRT on the Y axis for 57 ears. Each bubble radius is proportional to the number of measurements at that WB ASRT/Clinical ASRT threshold method combination for each ear. The diagonal line corresponds to equivalence between the two methods, and the dashed lines indicate the test limit of 90 dB SPL. Data plotted as 95 dB SPL for either method represent No Response at 90 dB SPL.

