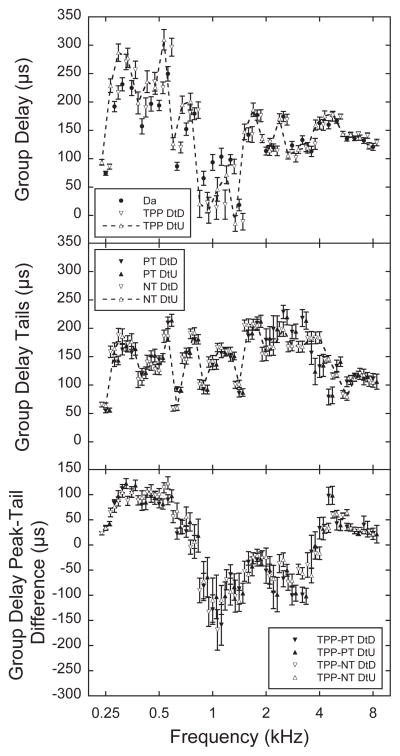
Figure 4.
Top panel shows the 5th and 95th percentile trimmed-mean group delay in μs as a function of frequency for Da and Dt at TPP for the downswept (DtD) and upswept (DtU) methods (N=57 ears). The remaining panels of the figure show standard means. Error bars represent ±1 SE of the mean for all panels. Middle panel shows the mean group delay in μs at the +200 daPa positive tail (PT) and −300 daPa negative tail (NT) conditions for DtD and DtU (N=57 ears). Bottom panel shows the mean TPP-minus-tail differences for group delay in μs for PT and NT conditions for DtD and DtU (N=57 ears). Symbols are jittered on the frequency axis for all panels for clarity.

