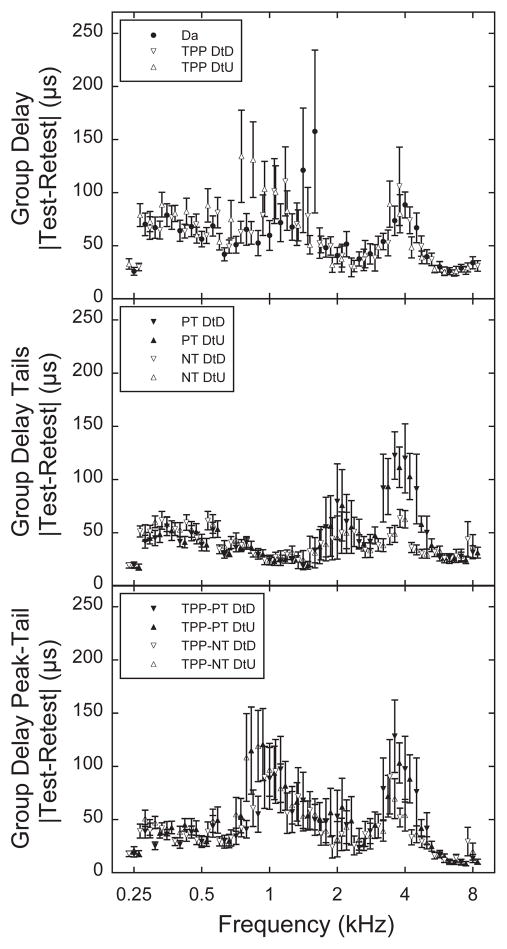
Figure 5.
Top panel shows the mean absolute value of the test-retest differences in group delay for Da, and Dt at TPP for the downswept (DtD) and upswept (DtU) methods (N=45 ears). Error bars represent ±1 SE of the mean for all panels. Middle panel shows the mean group delay absolute value of the test-retest differences for the positive tails (PT) and negative tails (NT) for DtD and DtU (N=45 ears). Bottom panel shows the mean group delay absolute value of the test-retest differences for TPP-minus-tail differences for the PT and NT for DtD and DtU (N=45 ears). Symbols are jittered on the frequency axis for all panels for clarity.

