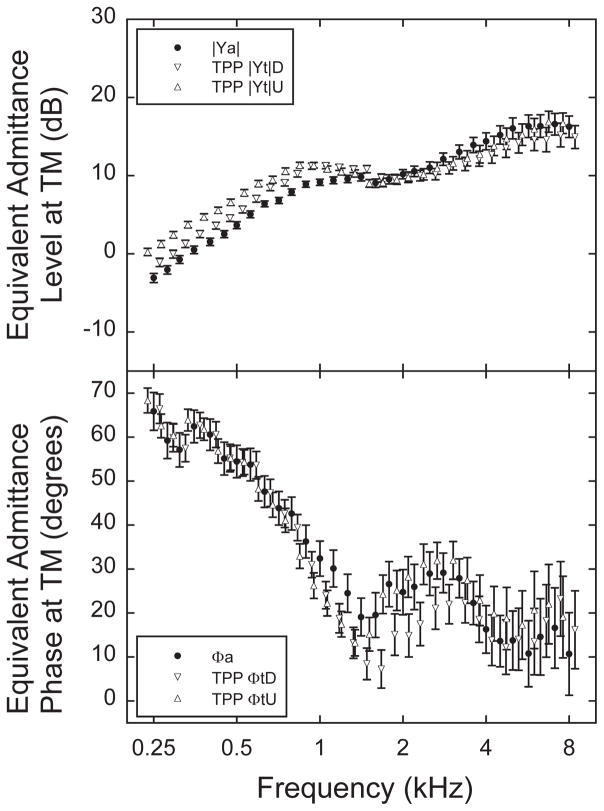
Figure 6.
Top panel shows the mean equivalent admittance level at ambient pressure |Ya| and at TPP for the downswept (|Yt|D) and upswept (|Yt|U) tympanograms (N=57 ears). Admittance level is normalized to 0 dB for an admittance magnitude of 1 mmho. Error bars represent ±1 SE of the mean for both panels. Bottom panel shows the mean equivalent admittance phase as a function of frequency at ambient pressure ϕa and at TPP ϕt for downswept (ϕtD) and upswept (ϕtU) tympanograms (N=57 ears).

