
Figure 3. LocusZoom plots of COL6A3, RYR3, KLF12 and LOC339975.
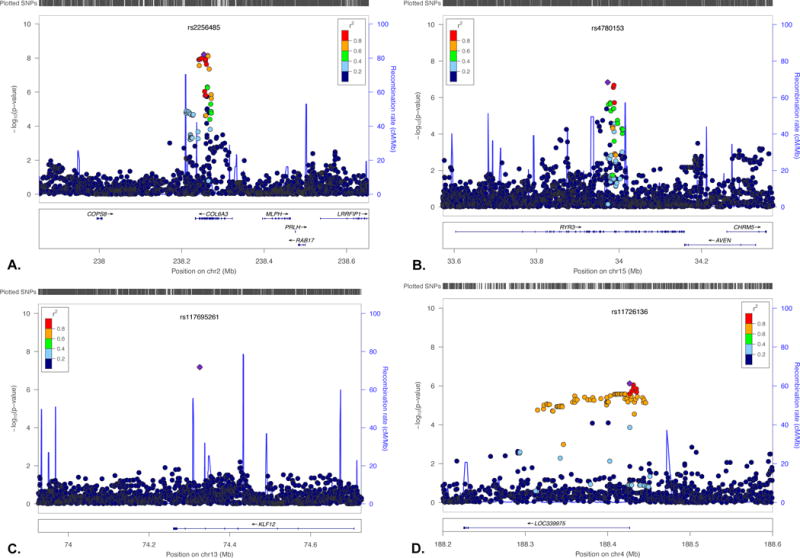
Genomewide significant results in COL6A3 (A) and three other regions of suggestive association supported by additional data, RYR3 (B), KLF12 (C) and LOC339975 (D).
Official websites use .gov
A
.gov website belongs to an official
government organization in the United States.
Secure .gov websites use HTTPS
A lock (
) or https:// means you've safely
connected to the .gov website. Share sensitive
information only on official, secure websites.
Genomewide significant results in COL6A3 (A) and three other regions of suggestive association supported by additional data, RYR3 (B), KLF12 (C) and LOC339975 (D).