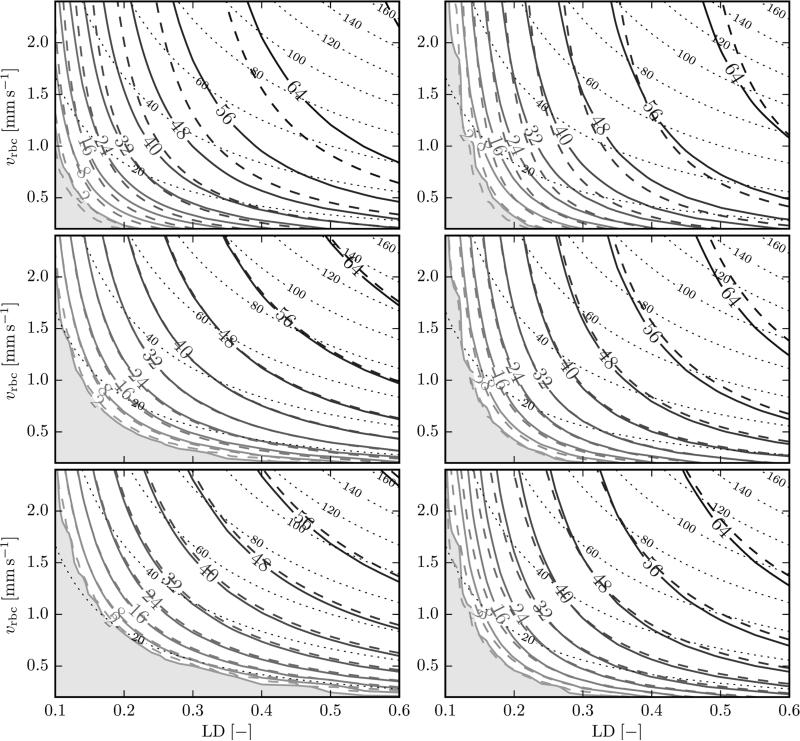
Figure 2.
Tissue Po2 as a function of LD and RBC velocity. Solid isolines: numerical results; dashed isolines: analytical model with fitted IVR coefficient. Left: cortex geometry, at 15 μm from the capillary wall (top: x = 40 μm, middle: x = 150 μm, bottom: x = 260 μm). Right: glomerulus geometry, at 10 μm from the capillary wall (top: x = 20 μm, middle: x = 50 μm, bottom: x = 80 μm). The shaded area shows the region where Po2 < 2 mmHg. The dotted lines show isolines of RBC flux (s−1).

