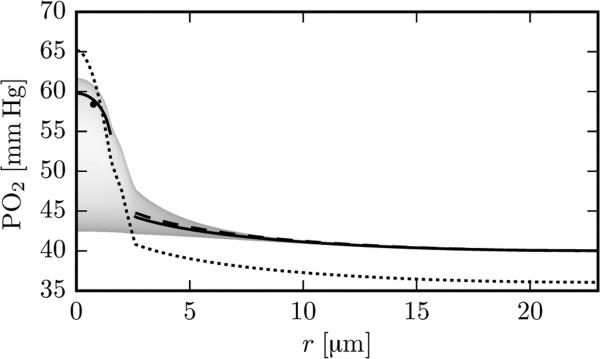
Figure 3.
Radial Po2 profile with μLD = 0.3 and vRBC = 1.2 mm/s at x = 150 μm in the cortex geometry. Solid line (in the RBC): Po2 from the numerical model, averaged over the RBC length when the RBC is centered at x = 150 μm; solid line (in the tissue): numerical time-averaged tissue Po2; dashed line: analytical tissue Po2 with fitted IVR coefficient; dotted line: analytical values based on Eqs. (12) to (16), without using an IVR coefficient. The shading indicates the frequency of the Po2 values from the numerical model. The black dot shows the averaged RBC PO2 value obtained from the analytical model.

