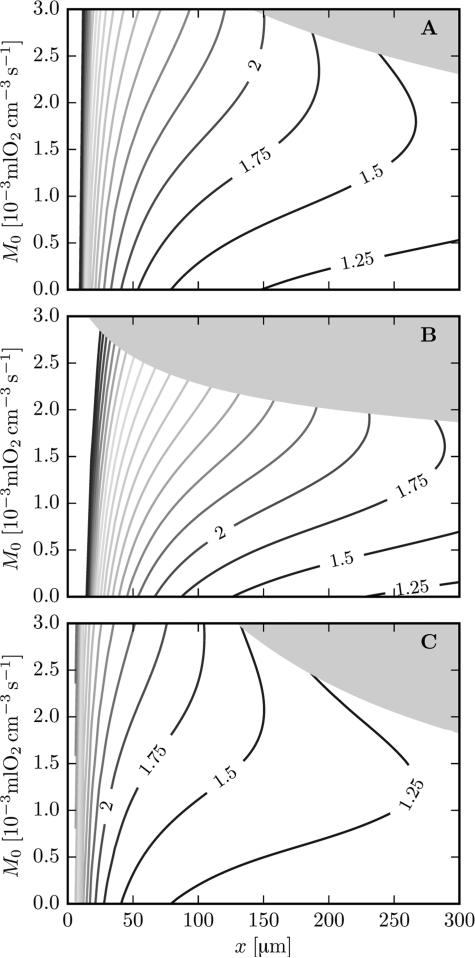
Figure 5.
Values of the function Z defined in Eq. (18) as a function of the axial position x and the rate of oxygen consumption M0. The computations were done in the cortex geometry. The shaded area shows hypoxic cases (Po2 < 2 mmHg). The highest contour value is 6.0. Top: μLD = 0.35, vRBC = 1.2 mm/s. Middle: μLD = 0.2, vRBC = 2.0 mm/s. Bottom: μLD = 0.5, vRBC = 0.6 mm/s.

