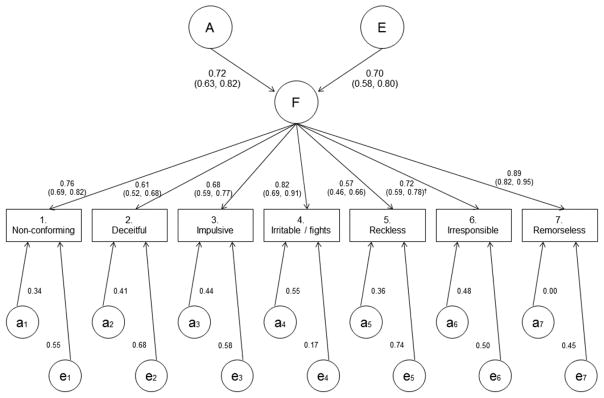
Figure 3.
Path diagram and parameter estimates of the best-fitting common-pathway biometric model. Estimates are from the model with scalar-translated rather than freely estimated threshold parameters, because that model was the best fit to data, but with all data, including separate-sex dizygotic twins. The numbers in parentheses provide 95% likelihood-profile confidence intervals. Superscript “†” refers to the one factor-loading interval estimate that did not properly converge and was estimated as the equivalent supplementary model on the same-sex twins only (see online supplement). Furthermore, reliable confidence intervals for the specific effects were unattainable, but an omnibus test indicated that also the genetic specific effects were significant (p = 0.004). Squares of the path coefficients give corresponding variance proportions: e.g., the common-pathway factor explained 100% × 0.892 = 79% of the total variance in remorselessness, or criterion 7, of which 100% × 0.722 = 52% is heritable variation. Table 3 lists the total heritabilities of the criteria.

