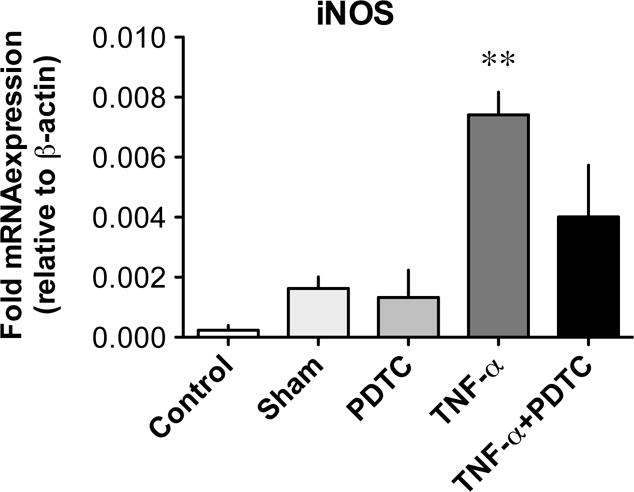
Figure 6. Effect of PDTC on the TNF-α-induced upregulation of iNOS in lymphatic vessels.

Bar graphs representing iNOS mRNA expression as measured by qPCR in lymphatic vessels without (control), and after 6 h of incubation in media alone (sham), 10 μM PDTC, TNF-α (3 ng/ml) and TNF-α plus PDTC. Gene expression was normalized to the expression of β-actin (n=4; **P<0.01 vs sham, one-way ANOVA with Bonferroni’s post-hoc test).
