Fig. 3.
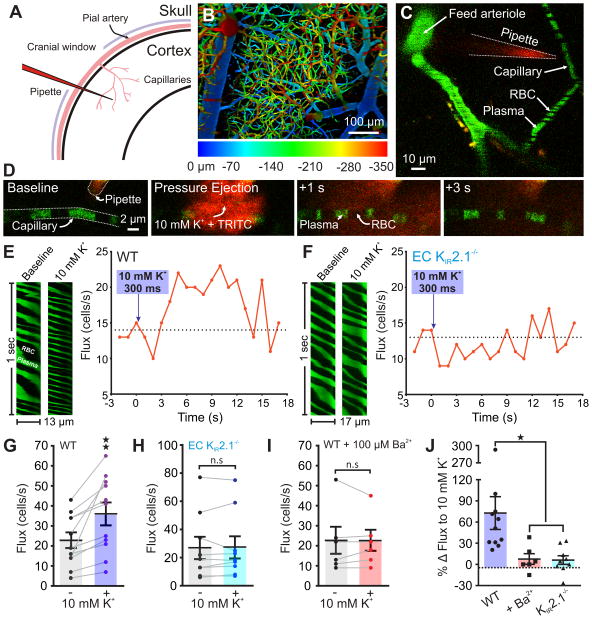
K+ causes capillary hyperemia in vivo through KIR2.1 channel activation. (A) Experimental paradigm. Mice were injected with FITC-dextran, then equipped with a cranial window through which the cerebral circulation was visualized using 2-photon laser-scanning microscopy (2PLSM). (B) Depth-coded micrograph of an area of the cortical vasculature. Capillaries downstream of penetrating parenchymal arterioles were identified for further analysis. (C) A pipette containing aCSF with 3 or 10 mM K+ plus TRITC-dextran was introduced next to a capillary, which was then line-scanned at 5 kHz during local pressure ejection of the pipette contents. (D) Micrographs depicting (left to right) the evolution of TRITC diffusion (red) after pressure ejection of 10 mM K+ (200 ms, 4 psi) onto a capillary (green). The brevity and low pressure of the ejection conditions ensured that K+ remained local. (E) Left: Baseline and peak distance-time plots of capillary line scans showing hyperemia to the ejection of 10 mM K+ onto a capillary. RBCs passing through the line-scanned capillary appear as black shadows against green fluorescent plasma. Right: Typical experimental time-course for a WT mouse showing RBC flux binned at 1-s intervals before and after pressure ejection of 10 mM K+ (300 ms, 8 psi; purple arrow) onto a capillary, demonstrating hyperemia to K+ delivery. (F) Left: Line scan plots for an experiment in which 10 mM K+ was pressure ejected onto a capillary in an EC KIR2.1−/− mouse, illustrating an absence of hyperemia to this maneuver. Right: Typical flux-time trace for an EC KIR2.1−/− mouse capillary. Pressure ejection of 10 mM K+ (300 ms, 8 psi; purple arrow) did not evoke hyperemia. (G) Summary RBC flux responses to 10 mM K+ in WT mice. K+ delivery caused significant hyperemia (n = 11 paired experiments, 11 mice; **P = 0.0038 (t10 = 3.75) paired Student’s t-test). (H) Summary data for EC KIR2.1−/− mice (n = 9 paired experiments, 9 mice). 10 mM K+ did not evoke hyperemia (P = 0.8265 (t8 = 0.2265) paired Student’s t-test). (I) Ba2+ (100 μM), applied to the cranial surface, inhibited capillary hyperemia to 10 mM K+ (n = 6 paired experiments, 6 mice; P > 0.99 (t5 = 0) paired Student’s t-test). (J) Change in RBC flux expressed as a percentage of baseline for each experimental group (*P = 0.016 vs. WT, FDFn,DFd = 4.9742,23, one-way ANOVA with Holm-Sidak’s multiple comparison test). All error bars represent s.e.m.

