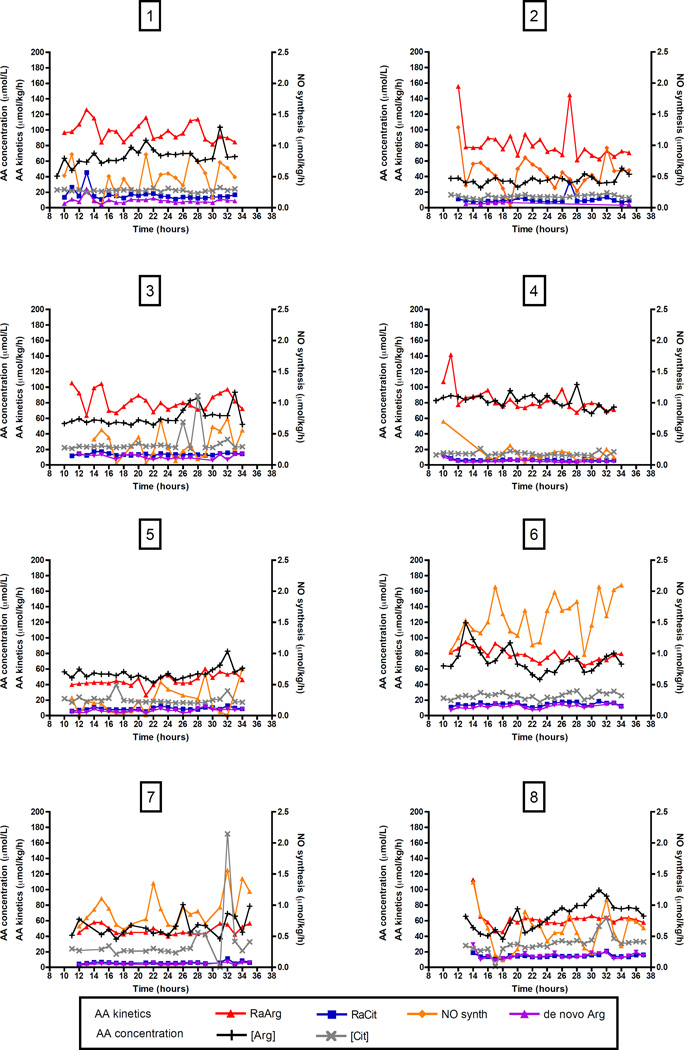
Figure 4. Individual phenylalanine kinetics over 24-hour.
Measurements over 24-hour are shown for 8 critically ill children individually per panel. Time is shown in clock hours (e.g. 8 hours = 8 am), values above 24 represent the next day. AA kinetics are shown on the left Y-axis, AA concentration on the right Y-axis.
AA, amino acid; [Arg], plasma arginine concentration; [Cit], plasma citrulline concentration; de novo Arg, de novo arginine synthesis; NO synth, NO synthesis; RaArg, rate of appearance of arginine; RaCit, rate of appearance of citrulline.

