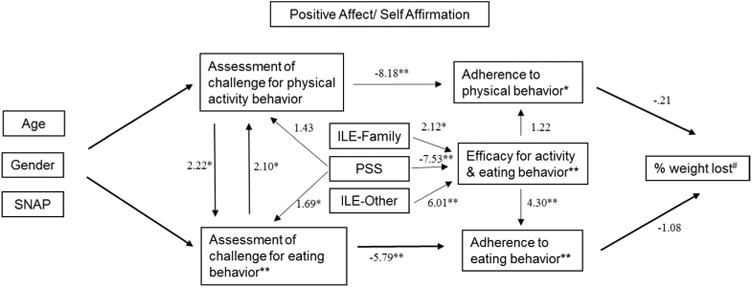
Figure 3. Path Model for the Effects of the Positive-Affect Self-Affirmation Intervention.

Direct effect t-statistics for the endogenous variables (percent of weight loss, adherence to eating behavior, adherence to physical behavior, efficacy for activity and eating behavior, assessment of challenge for eating behavior, and assessment of challenge for physical activity behavior) and some key exogenous variables (ILE-Family, ILE-Other, and PA/SA). The significance notations (*, **, #) within the rectangles containing the endogenous variables denote the significance of the PA/SA intervention. For the age gender and SNAP t-statistics and significance results see Table 3. Controls for site and community health worker using Huber-White standard errors. N=248 and the significance are denoted by #p<.1. * p<.05, **p<.01.
ILE-Family = Interval Life Events –Family Conflicts
ILE-Other = Interval Life Events – Other
PA/SA = Positive Affect/ Self-Affirmation Intervention
SNAP = Supplemental Nutrition Assistance Program
