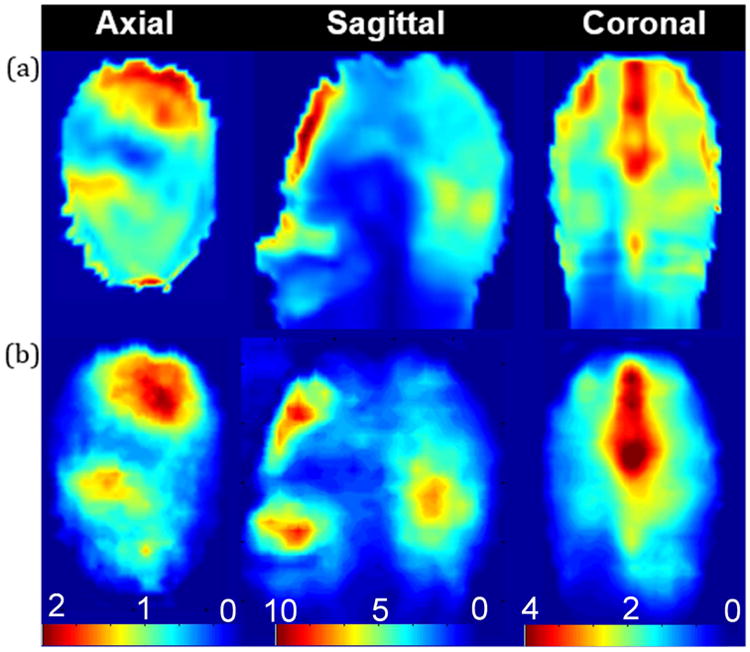
Fig. 2.

(a) Original 2D SAR pattern in W/kg, (b) 2D SAR pattern after reconstruction from thermoacoustic data. Qualitative agreement is reached in this first proof of concept based on a highly similar SAR distribution in all three planes. The standard deviation is 0.02 W/kg in the axial plane, 0.19 W/kg in the sagittal plane, and 0.12 W/kg in the sagittal plane. Quantitative agreement is clear from the matched overall absolute SAR. Peak local SAR values for simulation and experiment are 1.89 W/kg vs. 1.86 W/kg in the axial plane, 9.32 W/kg vs. 9.00 W/kg in the sagittal plane, and 3.29 W/kg vs 4.05 W/kg in the coronal plane.
