Figure 1.
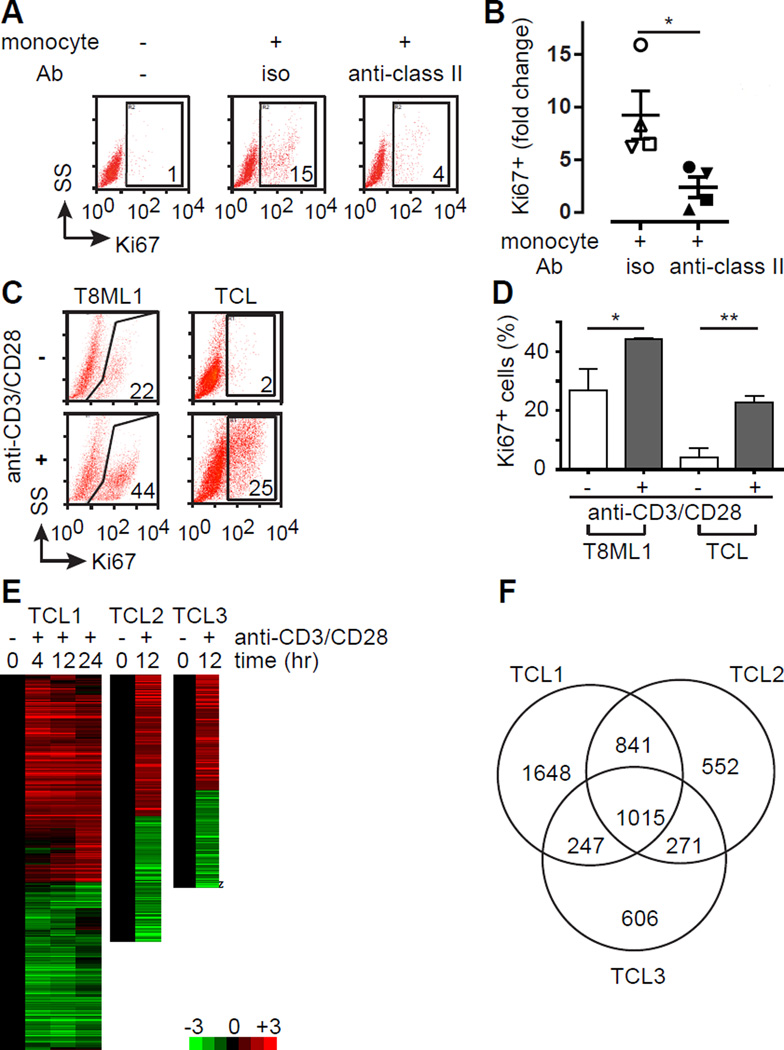
The TCR stimulates proliferation and activates gene expression in T-cell lymphomas. (A) Primary TCL cells were cultured for 7 days in the presence or absence of autologous monocytes with an isotype control (iso) or blocking MHC class II antibody (anti-class II), as indicated. TCL proliferation was determined by Ki67 expression, and the percentage of CD4+CD7− TCL cells that were Ki67+ is indicated in the gates shown in a representative FACS analysis (SS, side scatter). (B) TCL proliferation in the presence of autologous monocytes was independently determined (n=4) and was expressed as the fold increase in Ki67 expression compared with TCL cells cultured alone (mean ± s.e.m.). (C) The primary TCL cell line T8ML-1 and primary TCL cells were cultured in the presence (1:1 ratio) or absence of anti-CD3/CD28 beads and proliferation determined by Ki67 expression, as indicated in the representative examples shown. (D) The percentage of Ki67+ TCL cells (mean ± s.e.m.) cultured alone (open histogram) or with beads (gray histogram) is shown for T8ML-1 (in technical replicates) and for primary TCL cells (n=3). (E) Unsupervised hierarchical clustering highlighting changes (log2 transformed fold-change) in gene expression over time upon bead stimulation is shown for 3 TCL patients (Sezary syndrome=2, PTCL, NOS=1). (F) Venn diagram showing substantial overlap in differentially expressed genes among the 3 TCL patients examined. (*p<0.05, **p<0.01, ***p<0.001)

