
Figure 3.
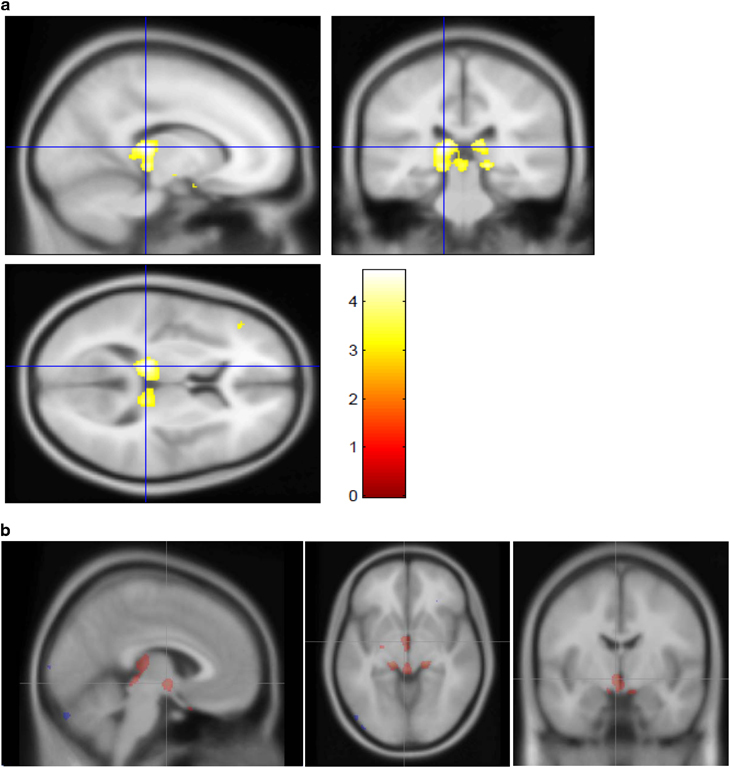
Largest clusters showing greater GM volume in TS compared with controls. (a) Largest cluster from GM>control contrast, in left pulvinar nucleus of thalamus (see Table 2 and legend to Figure 2). (b) The second largest cluster from the GM>control contrast, with the crosshairs at (4, 6, −6)MNI in hypothalamus. In this figure, all voxels with t⩾3.0 are highlighted in color to better visualize the underlying anatomy. GM, gray matter; MNI, Montreal Neurological Institute template brain coordinates; TS, Tourette syndrome.