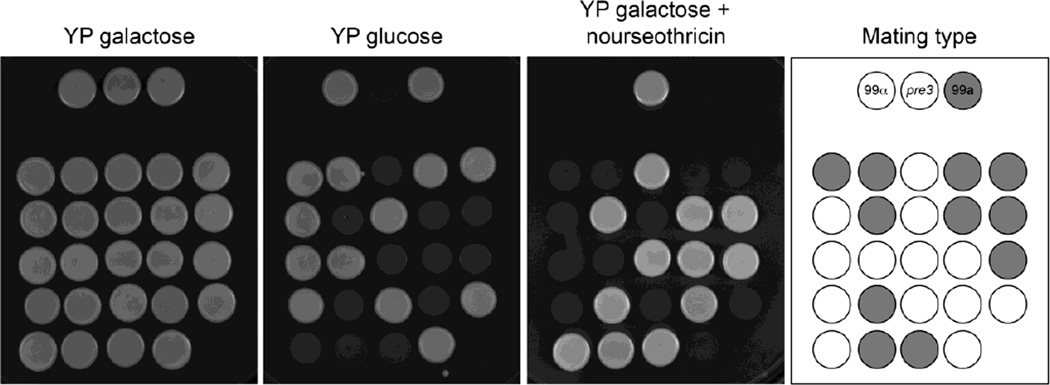
Fig. 4.
The T-DNA insertion segregates with reduced growth on glucose in progeny from a genetic cross between strain 3A11 (MATα) and wild type KN99a. The three strains at the top are wild type KN99α 3A11 and KN99a. They and the progeny were plated on three media and cultured 2 days. The diagram indicates mating types of the progeny obtained from the cross: grey circles MATa and white circles MATα.

