Figure 4.
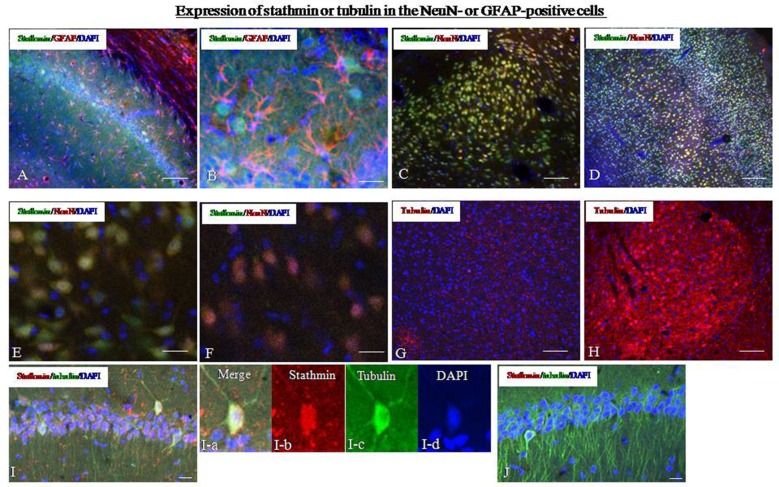
Expression of stathmin and tubulin in the hippocampus. (A) Dual-immunofluorescence image showing stathmin-ir and glial fibrillary acid protein (GFAP)-ir in the hippocampus of the control group. (B) A higher magnification image showing colocalization of stathmin-ir and GFAP-ir in the hippocampus of the control group. (C) Dual-immunofluorescence image showing stathmin-ir and NeuN-ir in the amygdala of the control group. (D) Dual-immunofluorescence image showing stathmin-ir and NeuN-ir in the cingulate cortex of the control group. (E) A higher magnification image showing colocalization of stathmin-ir and NeuN-ir in the amygdala of the control group. (F) A higher magnification image showing decreased stathmin in the amygdala of the SPS group. (G,H) Expression of tubulin in the amygdala of the control group (G) and the SPS group (H). (I,J) Colocalization of stathmin- and tubulin-ir in the hippocampal CA1 region of control (I) and SPS group (J). The magnification image of colocalzation of stahtmin- and tubulin-ir were showed in the I-a (merge), I-b (stathmin), I-c (tubulin0 and I-d (DAPI; *P < 0.05 vs. the control group; Bar in (B,D–F,I,J: 100 μm; Bar in A,C,G,H: 20 μm).

