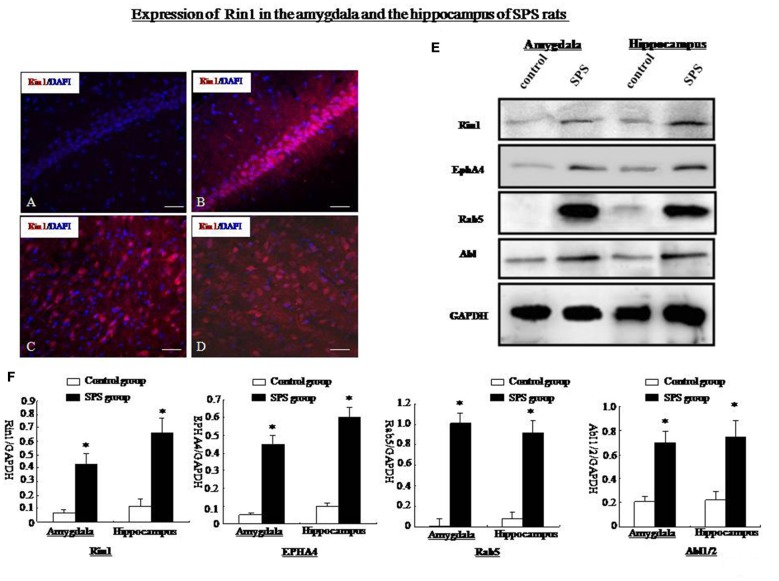
Figure 5.
(A) Rin1-ir in the hippocampus of the control group. (B) Rin1-ir in the hippocampus of the SPS group. (C) Rin1-ir in the amygdala of the SPS group. (D) Rin1-ir in the cingulate cortex of the SPS group. (E) Western blots showing expression of Rin1, EphA4, Rab5, and Abl in the amygdala and hippocampus of both groups. (F) Quantification of western blots showing higher expression of Rin1, EphA4, Rab5, and Abl in the amygdala and hippocampus of the SPS group compared with the control group (*P < 0.05 vs. the control group; Bar: 20 μm).

