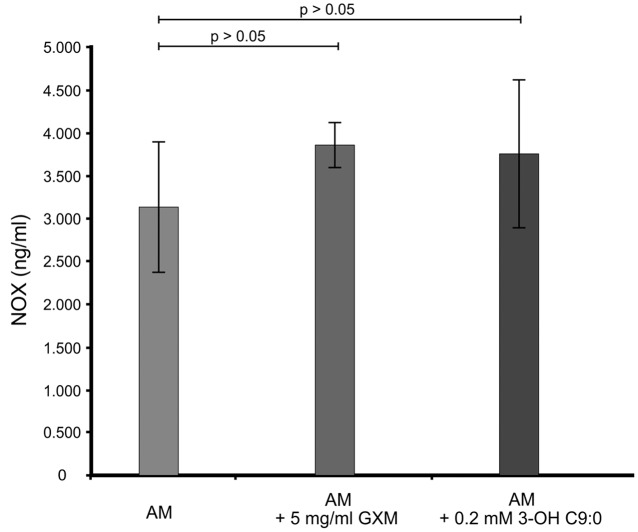
FIGURE 2.
The ELISA quantitative results showing the levels of NADPH oxidase-1 (NOX) present across the different experimental conditions i.e., GXM-treated amoeba (AM) and 3-OH C9:0-treated amoeba, including the control i.e., non-treated amoeba cells. There was no significant (p > 0.05) difference between the control results and the experimental conditions.

