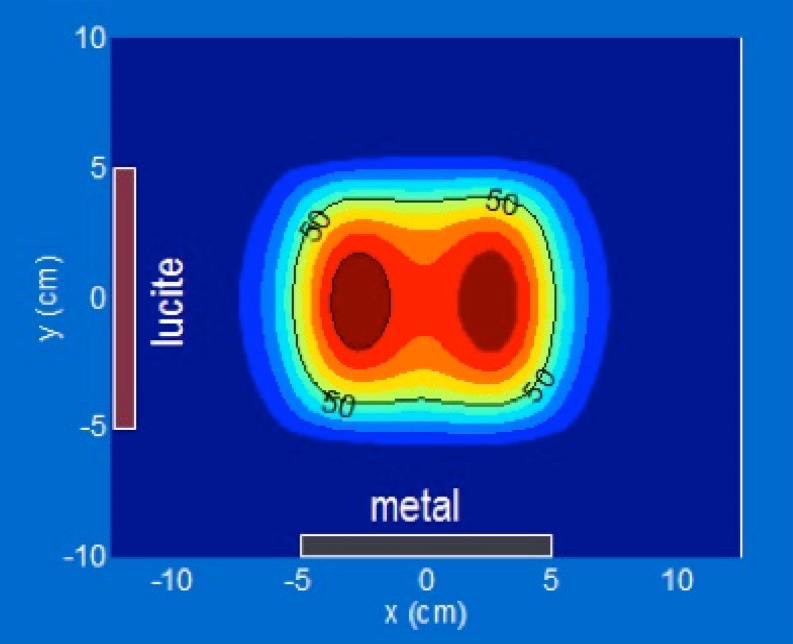
Fig. 3.
Calculated normalized specific absorption rate (SAR) distribution of a 10 × 10 cm lucite cone applicator (LCA) at 1 cm depth in a homogeneous muscle tissue phantom. The color scale from blue to dark red represents a 10% SAR increase for every color transition. Adapted from [66]

