
Fig. 10.
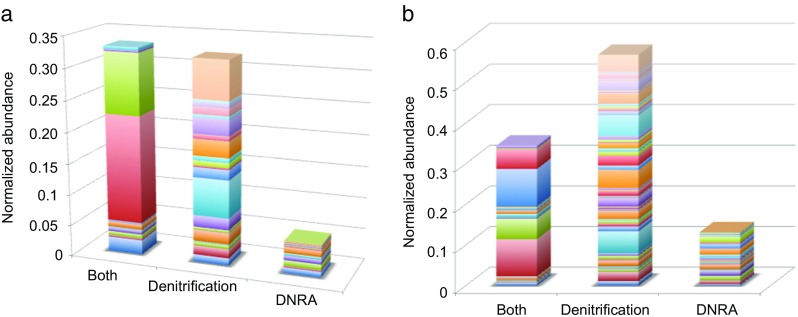
3-D charts showing the normalized abundances of genes predicted to be involved in denitrification and DNRA pathways (referred to as both), only in the denitrification pathway and only in the DNRA pathway in a SK and b BB samples
Official websites use .gov
A
.gov website belongs to an official
government organization in the United States.
Secure .gov websites use HTTPS
A lock (
) or https:// means you've safely
connected to the .gov website. Share sensitive
information only on official, secure websites.
3-D charts showing the normalized abundances of genes predicted to be involved in denitrification and DNRA pathways (referred to as both), only in the denitrification pathway and only in the DNRA pathway in a SK and b BB samples