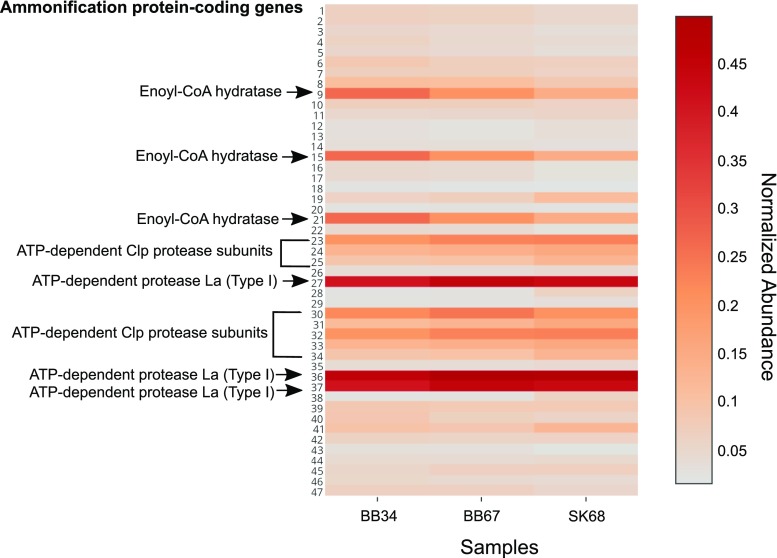
Fig. 6.
Heat map showing normalized protein-coding gene abundances predicted to be involved in ammonification metabolism detected in SK and BB metagenomes. The most abundant genes (red) and least abundant genes (grey). BB34 refers to sample 3–4 cmbsf (centimetre below sea-floor), BB67 refers to sample 6–7 cmbsf and SK68 refers to sample 6–8 cmbsf). Numbers on the y-axis correspond to the genes listed in Table 1. Values for samples were scaled from 0 (minimum value) to 1 (maximum value) using a uniform scaling method implemented in the MG-RAST pipeline. Forward and reverse abundances were averaged and a single value is reported per sample

