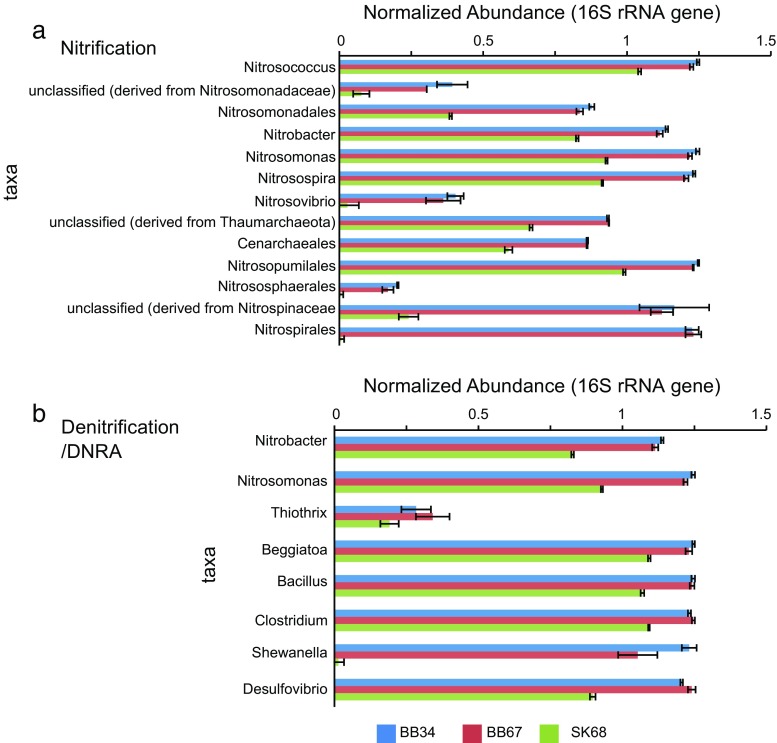
Fig. 7.
Normalized 16S rRNA gene abundances of microorganisms detected in SK and BB samples. Bar charts showing normalized 16S rRNA gene abundances of microorganisms able to perform a nitrification, b denitrification and DNRA. BB34 refers to sample 3–4 cmbsf (centimetre below sea-floor), BB67 refers to sample 6–7 cmbsf and SK68 refers to sample 6–8 cmbsf). Values for samples were scaled from 0 (minimum value) to 1 (maximum value) using a uniform scaling method implemented in the MG-RAST pipeline. Forward and reverse scaled abundances were averaged and a single value is reported per sample along with its standard deviation. The bar charts were generated using the MD5NR database, a maximum e value cut-off of 1e-05, minimum identity cut-off of 60% and a minimum alignment length cut-off 15

