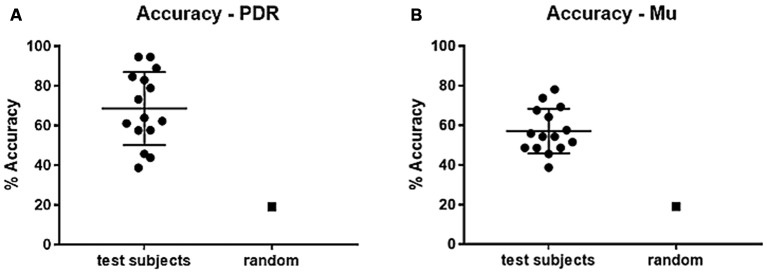
Figure 2.
Percent accuracy for PDR and Mu control. Individual subjects were given 5 min to hit as many target notes as possible using either PDR control or Mu control. Scatter plots of results of all subjects were generated (bars represent mean and standard deviation), with random (chance) control, for each of: (A) Percent accuracy using PDR control (standard error ± 4.7). (B) Percent accuracy using mu control (standard error ± 3.0).

