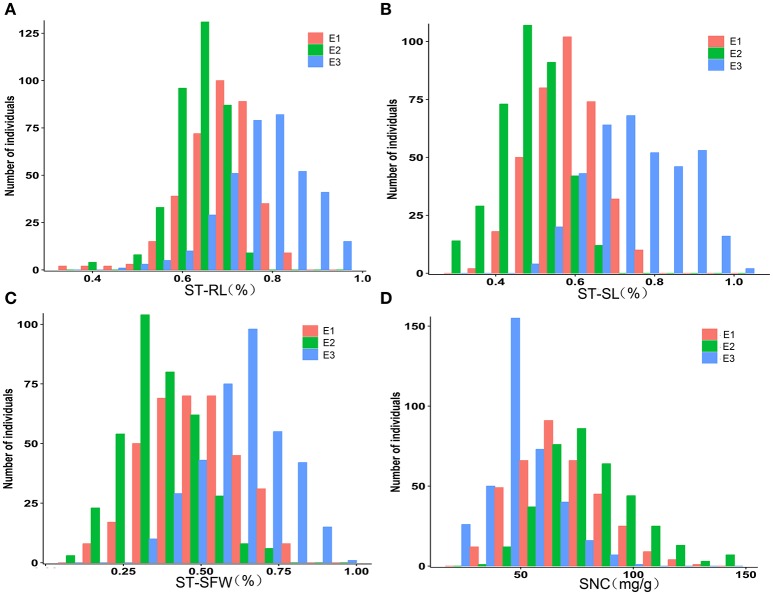
Figure 1.
Distribution of the three salt indices and SNC in the association panel of 368 accessions grown in three environments. (A) ST-RL. (B) ST-SL. (C) ST-SFW. (D) SNC. E1, greenhouse in 2013; E2, greenhouse in 2014; E3, natural environment condition in 2014. ST, salt tolerance index; RL, root length; SL, shoot length; SFW, shoot fresh weight.

