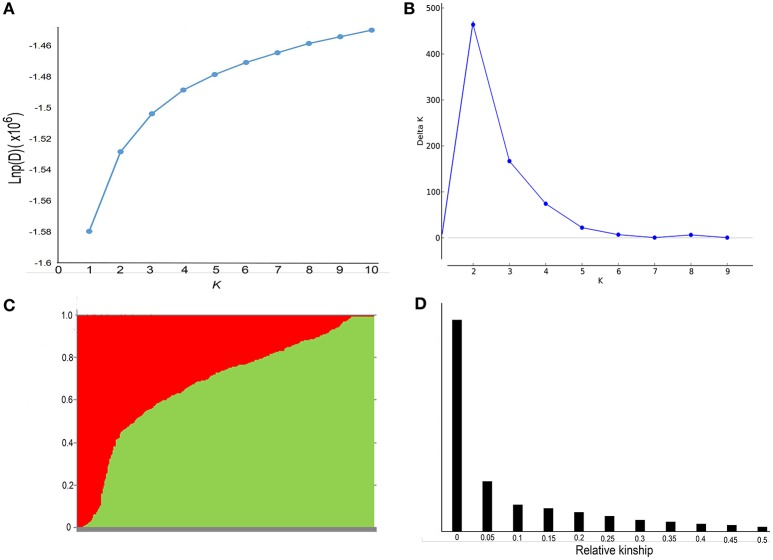
Figure 2.
Analysis of the population structure and relative kinships of the 368 rapeseed accessions. (A) Estimated LnP(D) of possible clusters (K) from 1 to 10. (B) ΔK was based on the rate of change of LnP(D) between successive K-values. (C) Population structure based on K = 2. Red represents Subgroup Q1; green, Subgroup Q2. (D) Distribution of pairwise relative kinship estimated in the entire population P (368 rapeseed accessions). Only kinship values ranging from 0 to 0.5 are shown.

