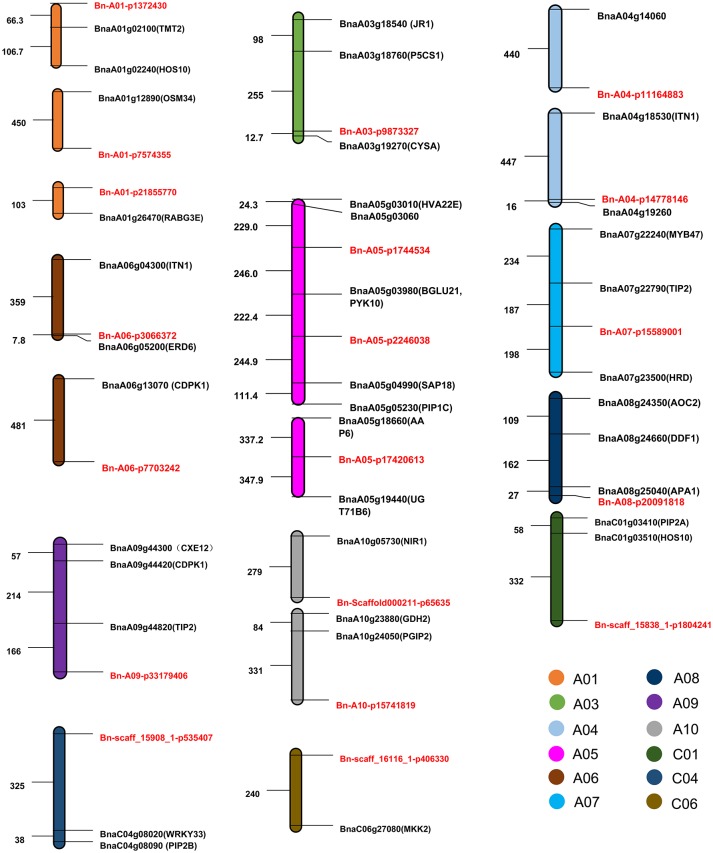
Figure 6.
The distribution pattern of candidate genes and their corresponding SNPs associated with salt tolerance (ST). The abbreviations of orthologous genes in Arabidopsis thaliana are shown in brackets after the candidate genes. SNPs are marked in red. Numbers represent the relative distances in the genome, 1 = 1 kb.

